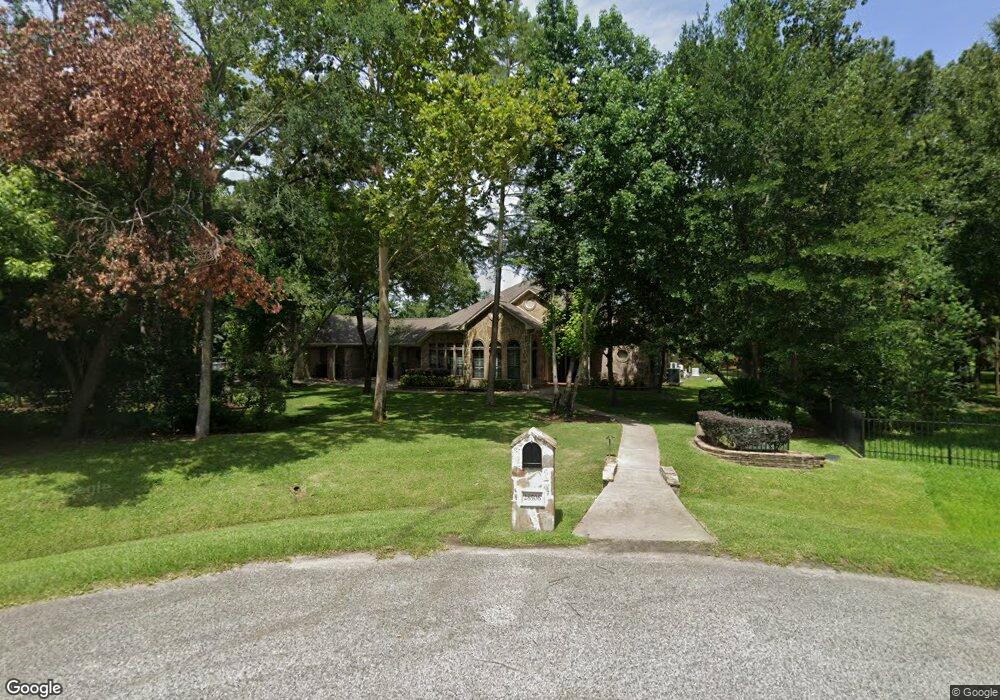
28506 Amandas Way Spring, TX 77386
Benders Landing NeighborhoodEstimated Value: $940,000 - $1,040,531
3
Beds
4
Baths
4,157
Sq Ft
$241/Sq Ft
Est. Value
About This Home
This home is located at 28506 Amandas Way, Spring, TX 77386 and is currently estimated at $1,003,633, approximately $241 per square foot. 28506 Amandas Way is a home located in Montgomery County with nearby schools including Snyder Elementary School, York J High School, and Grand Oaks High School.
Ownership History
Date
Name
Owned For
Owner Type
Purchase Details
Closed on
Aug 22, 2025
Sold by
Jeter Leslie and Jeter Wesley
Bought by
Wlj Living Trust and Van Jeter
Current Estimated Value
Purchase Details
Closed on
Oct 14, 2014
Sold by
Jensen Gary Lyn and Jensen Charlotte Ann
Bought by
Jeter Leslie and Jeter Wesley
Home Financials for this Owner
Home Financials are based on the most recent Mortgage that was taken out on this home.
Original Mortgage
$417,000
Interest Rate
4.13%
Mortgage Type
New Conventional
Purchase Details
Closed on
Nov 15, 2005
Sold by
Schanne Troy and Schanne Kathleen
Bought by
Jensen Gary Lyn and Jensen Charlotte Ann
Home Financials for this Owner
Home Financials are based on the most recent Mortgage that was taken out on this home.
Original Mortgage
$255,000
Interest Rate
5.92%
Mortgage Type
Construction
Purchase Details
Closed on
Sep 29, 2003
Sold by
Howes Daniel and Howes Mary
Bought by
Schanne Troy and Schanne Kathleen
Create a Home Valuation Report for This Property
The Home Valuation Report is an in-depth analysis detailing your home's value as well as a comparison with similar homes in the area
Home Values in the Area
Average Home Value in this Area
Purchase History
| Date | Buyer | Sale Price | Title Company |
|---|---|---|---|
| Wlj Living Trust | -- | None Listed On Document | |
| Jeter Leslie | -- | Great American Title | |
| Jensen Gary Lyn | -- | American Title Co | |
| Schanne Troy | -- | -- |
Source: Public Records
Mortgage History
| Date | Status | Borrower | Loan Amount |
|---|---|---|---|
| Previous Owner | Jeter Leslie | $417,000 | |
| Previous Owner | Jensen Gary Lyn | $255,000 |
Source: Public Records
Tax History Compared to Growth
Tax History
| Year | Tax Paid | Tax Assessment Tax Assessment Total Assessment is a certain percentage of the fair market value that is determined by local assessors to be the total taxable value of land and additions on the property. | Land | Improvement |
|---|---|---|---|---|
| 2025 | $12,676 | $951,800 | $356,942 | $594,858 |
| 2024 | $11,414 | $923,254 | -- | -- |
| 2023 | $11,414 | $839,320 | $221,070 | $625,860 |
| 2022 | $13,239 | $763,020 | $200,160 | $632,960 |
| 2021 | $12,824 | $693,650 | $122,050 | $586,670 |
| 2020 | $12,260 | $630,590 | $122,050 | $532,770 |
| 2019 | $11,548 | $573,260 | $126,000 | $447,260 |
| 2018 | $10,282 | $558,570 | $126,000 | $432,570 |
| 2017 | $10,733 | $533,570 | $126,000 | $407,570 |
| 2016 | $10,733 | $533,570 | $126,000 | $407,570 |
| 2015 | $7,431 | $533,570 | $126,000 | $407,570 |
| 2014 | $7,431 | $433,090 | $81,000 | $407,770 |
Source: Public Records
Map
Nearby Homes
- 4030 Steep Woods Dr
- 4065 Windsor Chase Dr
- 28654 Clear Woods Dr
- 4022 Sabine Valley Trail
- 4011 Northern Spruce Dr
- 3240 Raintree Crescent Trail
- 28610 Pinnacle Point Place
- 3954 Kelley Pond Dr
- 28961 San Bernard River Loop
- 27720 Hazelbrook Ln
- 4710 Comal River Loop
- 3702 Deerbend Ct
- 28016 Shining Trails Ct
- 28012 Shining Trails Ct
- 28009 Shining Trails Ct
- 4136 Sandalwood Ln
- Camden Plan at Woodson's Reserve - Woodson’s Reserve 80′
- Salerno Plan at Woodson's Reserve - Woodson’s Reserve 80′
- Milan Plan at Woodson's Reserve - Woodson’s Reserve 80′
- Carignan Plan at Woodson's Reserve - Woodson’s Reserve 80′
- 4051 Steep Woods Dr
- 4050 Steep Woods Dr
- 28502 Amandas Way
- 28507 Amandas Way
- 4047 Steep Woods Dr
- 28602 Laurens Landing
- 4046 Steep Woods Dr
- 28503 Amandas Way
- 4043 Steep Woods Dr
- 4008 Windsor Chase Dr
- 4042 Steep Woods Dr
- 3907 Egret Ct
- 4039 Steep Woods Dr
- 4010 Clear Woods Ct
- 28603 Laurens Landing
- 4038 Steep Woods Dr
- 4016 Windsor Chase Dr
- 4004 Windsor Chase Dr
- 4035 Steep Woods Dr
- 4000 Windsor Chase Dr