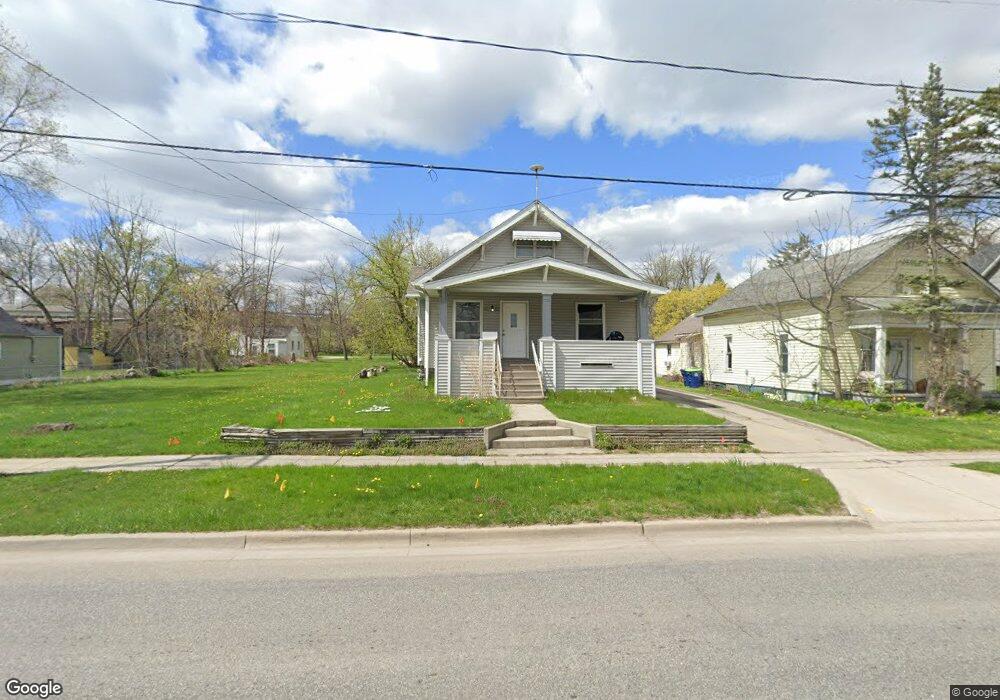
2851 N Michigan Ave Saginaw, MI 48604
Estimated Value: $84,000 - $101,000
2
Beds
2
Baths
960
Sq Ft
$96/Sq Ft
Est. Value
About This Home
This home is located at 2851 N Michigan Ave, Saginaw, MI 48604 and is currently estimated at $92,239, approximately $96 per square foot. 2851 N Michigan Ave is a home located in Saginaw County with nearby schools including Finch Elementary School, Carrollton Elementary School, and Carrollton Middle School.
Ownership History
Date
Name
Owned For
Owner Type
Purchase Details
Closed on
Jul 13, 2022
Sold by
Zaninovich and Carrie
Bought by
Ps Tri Homes Llc
Current Estimated Value
Home Financials for this Owner
Home Financials are based on the most recent Mortgage that was taken out on this home.
Original Mortgage
$1,176,825
Outstanding Balance
$1,126,014
Interest Rate
5.78%
Mortgage Type
New Conventional
Estimated Equity
-$1,033,775
Purchase Details
Closed on
Jul 25, 2011
Sold by
Penkala Karen
Bought by
Federal Home Loan Mortgage Corporation
Purchase Details
Closed on
Jun 10, 2011
Sold by
Kappen Brenda
Bought by
Federal Home Loan Mortgage Corp
Purchase Details
Closed on
Aug 17, 2001
Home Financials for this Owner
Home Financials are based on the most recent Mortgage that was taken out on this home.
Original Mortgage
$25,600
Interest Rate
7.03%
Create a Home Valuation Report for This Property
The Home Valuation Report is an in-depth analysis detailing your home's value as well as a comparison with similar homes in the area
Home Values in the Area
Average Home Value in this Area
Purchase History
| Date | Buyer | Sale Price | Title Company |
|---|---|---|---|
| Ps Tri Homes Llc | -- | Diversified National Title | |
| Federal Home Loan Mortgage Corporation | $3,500 | -- | |
| Federal Home Loan Mortgage Corp | $36,788 | -- | |
| -- | $32,000 | -- | |
| Penkala Karen | $32,000 | -- |
Source: Public Records
Mortgage History
| Date | Status | Borrower | Loan Amount |
|---|---|---|---|
| Open | Ps Tri Homes Llc | $1,176,825 | |
| Previous Owner | Penkala Karen | $25,600 |
Source: Public Records
Tax History Compared to Growth
Tax History
| Year | Tax Paid | Tax Assessment Tax Assessment Total Assessment is a certain percentage of the fair market value that is determined by local assessors to be the total taxable value of land and additions on the property. | Land | Improvement |
|---|---|---|---|---|
| 2025 | $2,049 | $36,400 | $0 | $0 |
| 2024 | $292 | $36,000 | $0 | $0 |
| 2023 | $278 | $25,400 | $0 | $0 |
| 2022 | $1,273 | $17,600 | $0 | $0 |
| 2021 | $1,206 | $17,400 | $0 | $0 |
| 2020 | $1,429 | $18,500 | $0 | $0 |
| 2019 | $1,082 | $17,500 | $3,200 | $14,300 |
| 2018 | $159 | $14,500 | $0 | $0 |
| 2017 | $1,191 | $16,400 | $0 | $0 |
| 2016 | $1,212 | $18,400 | $0 | $0 |
| 2014 | -- | $17,100 | $0 | $13,600 |
| 2013 | -- | $17,600 | $0 | $0 |
Source: Public Records
Map
Nearby Homes
- 2917 N Michigan Ave
- 2955 Eddy St
- 3035 Schaeffer St
- 2989 Harrison St
- 2626 Hermansau St
- 3011 Harrison St
- 3004 Harrison St
- 402 Oak St
- 2545 Hermansau St
- 2997 Jackson St
- 548 Shattuck Rd
- 1020 Reed St
- 2440 Hermansau St
- 644 Meadowlawn St
- 269 Shattuck Rd
- 2161 Plainview Dr
- 920 Cronk Ave
- 2234 Shattuck Rd
- 2450 N Mason St
- 2114 Hanchett St
- 2841 N Michigan Ave
- 2861 N Michigan Ave
- 2831 N Michigan Ave
- 2871 N Michigan Ave
- 2821 N Michigan Ave
- 2881 N Michigan Ave
- 2848 N Michigan Ave
- 2850 N Michigan Ave
- 2830 Schaefer St
- 2836 N Michigan Ave
- 2876 N Michigan Ave
- 2828 N Michigan Ave
- 2891 N Michigan Ave
- 2876 Schaefer St
- 2890 N Michigan Ave
- 2851 Eddy St
- 2899 N Michigan Ave
- 2801 N Michigan Ave
- 2886 Schaefer St
- 2896 Schaefer St