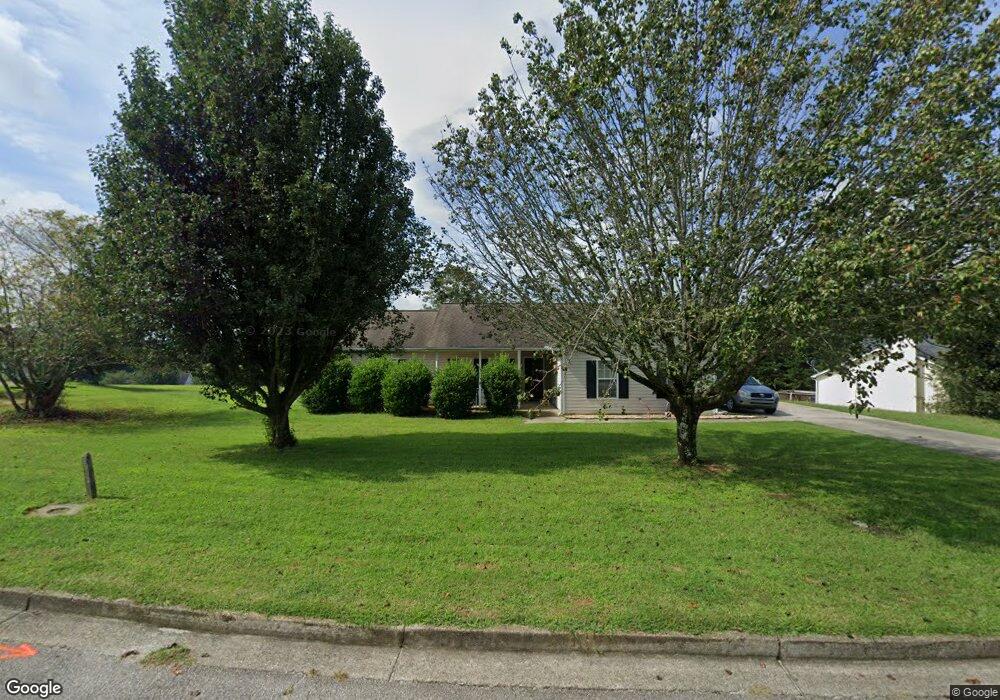
2852 Sam Calvin Dr Dacula, GA 30019
Estimated Value: $313,000 - $336,000
3
Beds
2
Baths
1,282
Sq Ft
$250/Sq Ft
Est. Value
About This Home
This home is located at 2852 Sam Calvin Dr, Dacula, GA 30019 and is currently estimated at $321,071, approximately $250 per square foot. 2852 Sam Calvin Dr is a home located in Gwinnett County with nearby schools including Harbins Elementary School, McConnell Middle School, and Archer High School.
Ownership History
Date
Name
Owned For
Owner Type
Purchase Details
Closed on
Dec 15, 2004
Sold by
Watkins John C
Bought by
Watkins John C and Watkins Barbara
Current Estimated Value
Home Financials for this Owner
Home Financials are based on the most recent Mortgage that was taken out on this home.
Original Mortgage
$27,400
Interest Rate
5.67%
Mortgage Type
Unknown
Purchase Details
Closed on
Jun 25, 2001
Sold by
Shirley Tracey M
Bought by
Dunney William R and Dunney Theresa A
Home Financials for this Owner
Home Financials are based on the most recent Mortgage that was taken out on this home.
Original Mortgage
$105,200
Interest Rate
7.14%
Mortgage Type
New Conventional
Purchase Details
Closed on
Mar 26, 1999
Sold by
Southfork Homes Inc
Bought by
Dunney Tracey M
Home Financials for this Owner
Home Financials are based on the most recent Mortgage that was taken out on this home.
Original Mortgage
$106,300
Interest Rate
6.85%
Mortgage Type
FHA
Create a Home Valuation Report for This Property
The Home Valuation Report is an in-depth analysis detailing your home's value as well as a comparison with similar homes in the area
Home Values in the Area
Average Home Value in this Area
Purchase History
| Date | Buyer | Sale Price | Title Company |
|---|---|---|---|
| Watkins John C | $137,000 | -- | |
| Watkins John C | $137,000 | -- | |
| Dunney William R | $116,900 | -- | |
| Dunney Tracey M | $106,400 | -- |
Source: Public Records
Mortgage History
| Date | Status | Borrower | Loan Amount |
|---|---|---|---|
| Closed | Watkins John C | $27,400 | |
| Open | Watkins John C | $109,600 | |
| Previous Owner | Dunney William R | $105,200 | |
| Previous Owner | Dunney Tracey M | $106,300 |
Source: Public Records
Tax History Compared to Growth
Tax History
| Year | Tax Paid | Tax Assessment Tax Assessment Total Assessment is a certain percentage of the fair market value that is determined by local assessors to be the total taxable value of land and additions on the property. | Land | Improvement |
|---|---|---|---|---|
| 2025 | $2,713 | $115,360 | $20,120 | $95,240 |
| 2024 | $2,662 | $107,080 | $20,120 | $86,960 |
| 2023 | $2,662 | $109,800 | $28,000 | $81,800 |
| 2022 | $2,438 | $95,720 | $24,800 | $70,920 |
| 2021 | $2,401 | $66,800 | $17,200 | $49,600 |
| 2020 | $2,417 | $66,800 | $17,200 | $49,600 |
| 2019 | $2,187 | $60,040 | $15,600 | $44,440 |
| 2018 | $2,052 | $54,640 | $12,800 | $41,840 |
| 2016 | $1,811 | $46,840 | $11,200 | $35,640 |
| 2015 | $1,623 | $41,480 | $8,800 | $32,680 |
| 2014 | -- | $41,480 | $8,800 | $32,680 |
Source: Public Records
Map
Nearby Homes
- 2960 Williams Farm Dr
- 2920 Williams Farm Dr
- 2622 Sam Calvin Dr
- 2827 James Henry Dr
- 469 Ralph Still Rd
- 1737 Rolling View Way
- 3137 Cove View Ct
- 3126 Cove View Ct
- 3126 Cove View Ct SE
- 1354 Slate Bend Dr
- 1365 Slate Bend Dr
- 1401 Barimore Ct
- 1476 Rolling View Way
- 1314 Bentley Estates Dr
- 795 Tanner Rd
- 3278 Durston Ct
- 000 Hog Mountain Church Road and Auburn Rd
- 3187 Eastham Run Dr
- 3276 Durston Ct
- 3280 Durston Ct
- 2872 Sam Calvin Dr
- 2832 Sam Calvin Dr
- 2882 Sam Calvin Dr
- 2812 Sam Calvin Dr
- 2853 Sam Calvin Dr
- 2833 Sam Calvin Dr
- 2863 Sam Calvin Dr
- 2873 Sam Calvin Dr
- 2892 Sam Calvin Dr
- 2792 Sam Calvin Dr
- 940 Peter Josiah Ct
- 2925 Ben Arron Dr
- 950 Peter Josiah Ct
- 2926 Ben Arron Dr
- 930 Peter Josiah Ct
- 2883 Sam Calvin Dr
- 0 Carly Joanna Ct Unit 3281852
- 0 Carly Joanna Ct Unit 8247149
- 2902 Sam Calvin Dr