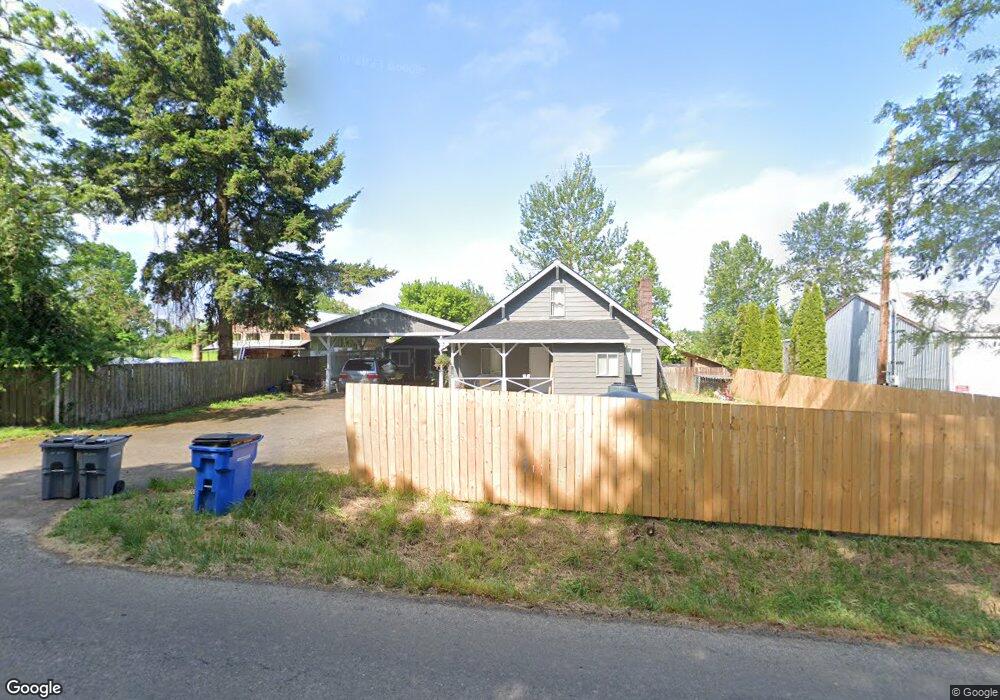
28520 NW 31st Ave Ridgefield, WA 98642
Estimated Value: $420,000 - $486,000
3
Beds
1
Bath
1,260
Sq Ft
$355/Sq Ft
Est. Value
About This Home
This home is located at 28520 NW 31st Ave, Ridgefield, WA 98642 and is currently estimated at $447,578, approximately $355 per square foot. 28520 NW 31st Ave is a home located in Clark County with nearby schools including Ridgefield High School and Mountain View Christian School.
Ownership History
Date
Name
Owned For
Owner Type
Purchase Details
Closed on
Jun 22, 2021
Sold by
Garcia Rogelio
Bought by
Flores Lisbet N
Current Estimated Value
Home Financials for this Owner
Home Financials are based on the most recent Mortgage that was taken out on this home.
Original Mortgage
$373,117
Outstanding Balance
$337,811
Interest Rate
2.9%
Mortgage Type
FHA
Estimated Equity
$109,767
Purchase Details
Closed on
Dec 22, 2020
Sold by
Gervais Alan F
Bought by
Walters Justin and Walters Brynn
Purchase Details
Closed on
Mar 17, 2005
Sold by
Colantino Ronald and Colantino Cheri
Bought by
Gervais Alan F
Home Financials for this Owner
Home Financials are based on the most recent Mortgage that was taken out on this home.
Original Mortgage
$97,500
Interest Rate
5.61%
Mortgage Type
Seller Take Back
Create a Home Valuation Report for This Property
The Home Valuation Report is an in-depth analysis detailing your home's value as well as a comparison with similar homes in the area
Home Values in the Area
Average Home Value in this Area
Purchase History
| Date | Buyer | Sale Price | Title Company |
|---|---|---|---|
| Flores Lisbet N | -- | Chicago Tite Vancovuer Mall | |
| Flores Lisbet N | $380,000 | Chicago Title Vancouver Mall | |
| Walters Justin | $269,000 | Clark County Title Company | |
| Gervais Alan F | -- | Cascade Title | |
| Gervais Alan F | $107,500 | Clark County Title |
Source: Public Records
Mortgage History
| Date | Status | Borrower | Loan Amount |
|---|---|---|---|
| Open | Flores Lisbet N | $373,117 | |
| Previous Owner | Gervais Alan F | $97,500 |
Source: Public Records
Tax History Compared to Growth
Tax History
| Year | Tax Paid | Tax Assessment Tax Assessment Total Assessment is a certain percentage of the fair market value that is determined by local assessors to be the total taxable value of land and additions on the property. | Land | Improvement |
|---|---|---|---|---|
| 2025 | $2,957 | $321,694 | $109,312 | $212,382 |
| 2024 | $2,847 | $307,136 | $109,312 | $197,824 |
| 2023 | $2,467 | $319,251 | $109,312 | $209,939 |
| 2022 | $2,310 | $264,913 | $110,568 | $154,345 |
| 2021 | $2,197 | $231,229 | $103,244 | $127,985 |
| 2020 | $2,105 | $205,493 | $92,501 | $112,992 |
| 2019 | $2,056 | $193,828 | $88,107 | $105,721 |
| 2018 | $2,133 | $191,377 | $0 | $0 |
| 2017 | $1,698 | $171,656 | $0 | $0 |
| 2016 | $1,504 | $158,817 | $0 | $0 |
| 2015 | $1,502 | $133,816 | $0 | $0 |
| 2014 | -- | $127,726 | $0 | $0 |
| 2013 | -- | $118,608 | $0 | $0 |
Source: Public Records
Map
Nearby Homes
- 4208 N 12th Way
- 0 Paradise Pointe Unit 252
- 0 Paradise Pointe Unit 246
- 0 Paradise Pointe Unit 262
- 0 Paradise Pointe Unit 280
- 0 Paradise Pointe Unit 256
- 0 Paradise Pointe Unit 275
- 0 Paradise Pointe Unit 268
- 0 Paradise Pointe Unit 224
- 1164 N 44th Place
- The Tamarack Plan at Paradise Pointe
- The 3370 Plan at Paradise Pointe
- The 3297 Plan at Paradise Pointe
- The 3967 Plan at Paradise Pointe
- The 2821 Plan at Paradise Pointe
- The 2978 Plan at Paradise Pointe
- The Chelan Plan at Paradise Pointe
- The Willow Plan at Paradise Pointe
- The Juniper Plan at Paradise Pointe
- The Evergreen Plan at Paradise Pointe
- 1705 N Royle Rd
- 28522 NW 31st Ave
- 1650 N Royle Rd
- 1650 N Royle Rd
- 28502 NW 31st Ave
- 1655 N Royle Rd
- 1755 N Royle Rd
- 3319 NW 289th St
- 4324 N 12th Way
- 1350 N Royle Rd
- 0 Unit 437142956
- 0 Paradise Pointe 231 Unit 264647777
- 3406 NW 289th St
- 1302 N Kalani Loop Unit 37408869
- 1302 N Kalani Loop Unit 36394506
- 1302 N Kalani Loop Unit 36394504
- 1302 N Kalani Loop Unit 36456695
- 1302 N Kalani Loop Unit 36483968
- 1302 N Kalani Loop Unit 36463454
- 1302 N Kalani Loop Unit 36466527