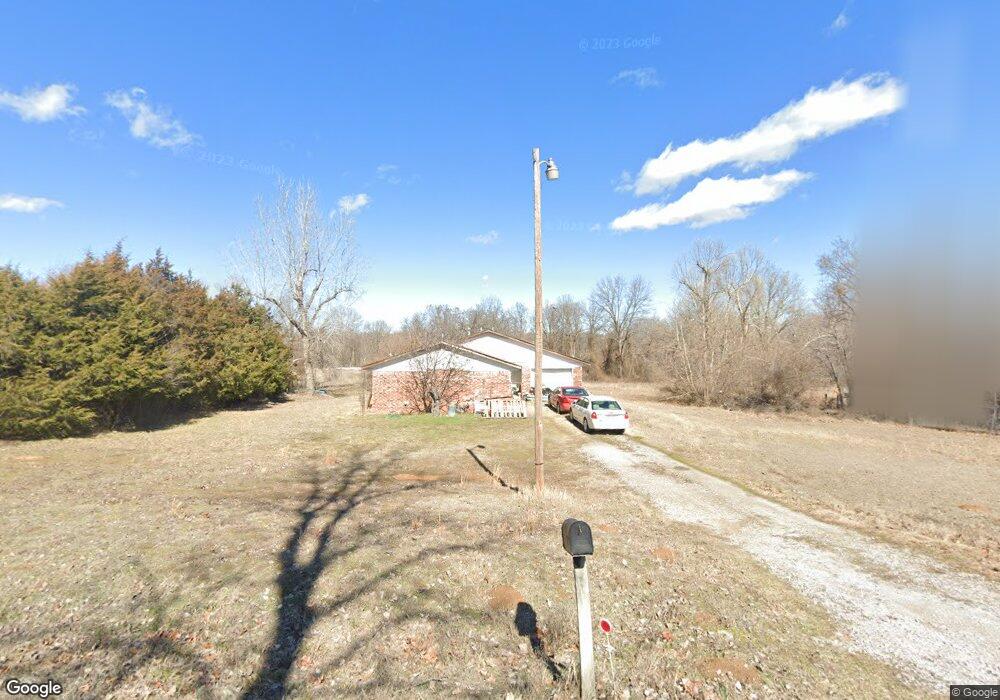
2853 Hickory Bluff Rd Sapulpa, OK 74066
Estimated Value: $108,000 - $147,000
3
Beds
2
Baths
1,165
Sq Ft
$111/Sq Ft
Est. Value
About This Home
This home is located at 2853 Hickory Bluff Rd, Sapulpa, OK 74066 and is currently estimated at $129,343, approximately $111 per square foot. 2853 Hickory Bluff Rd is a home located in Creek County with nearby schools including Sapulpa Junior High School, Sapulpa Middle School, and Sapulpa High School.
Ownership History
Date
Name
Owned For
Owner Type
Purchase Details
Closed on
May 12, 2023
Sold by
Powers Mary D
Bought by
Powers Daish M
Current Estimated Value
Purchase Details
Closed on
Oct 28, 2011
Sold by
Federal National Mortgage Association
Bought by
Powers Mary D
Purchase Details
Closed on
Aug 1, 2011
Sold by
Mowry Gretehen A
Bought by
Federal National Mortgage Association
Purchase Details
Closed on
Apr 12, 2006
Sold by
Fox Stephen and Fox Marilyn
Bought by
Mowry Gretchen A
Home Financials for this Owner
Home Financials are based on the most recent Mortgage that was taken out on this home.
Original Mortgage
$72,000
Interest Rate
6.22%
Mortgage Type
Construction
Create a Home Valuation Report for This Property
The Home Valuation Report is an in-depth analysis detailing your home's value as well as a comparison with similar homes in the area
Home Values in the Area
Average Home Value in this Area
Purchase History
| Date | Buyer | Sale Price | Title Company |
|---|---|---|---|
| Powers Daish M | -- | None Listed On Document | |
| Powers Mary D | $38,151 | -- | |
| Federal National Mortgage Association | $68,607 | -- | |
| Mowry Gretchen A | $39,000 | None Available |
Source: Public Records
Mortgage History
| Date | Status | Borrower | Loan Amount |
|---|---|---|---|
| Previous Owner | Mowry Gretchen A | $72,000 |
Source: Public Records
Tax History Compared to Growth
Tax History
| Year | Tax Paid | Tax Assessment Tax Assessment Total Assessment is a certain percentage of the fair market value that is determined by local assessors to be the total taxable value of land and additions on the property. | Land | Improvement |
|---|---|---|---|---|
| 2025 | $490 | $5,691 | $1,189 | $4,502 |
| 2024 | $368 | $5,525 | $1,154 | $4,371 |
| 2023 | $368 | $5,365 | $1,123 | $4,242 |
| 2022 | $335 | $5,364 | $1,186 | $4,178 |
| 2021 | $342 | $5,364 | $1,409 | $3,955 |
| 2020 | $346 | $5,364 | $1,780 | $3,584 |
| 2019 | $353 | $5,364 | $1,593 | $3,771 |
| 2018 | $359 | $5,364 | $1,513 | $3,851 |
| 2017 | $360 | $5,364 | $1,513 | $3,851 |
| 2016 | $335 | $5,364 | $1,513 | $3,851 |
| 2015 | -- | $5,364 | $1,513 | $3,851 |
| 2014 | -- | $5,364 | $981 | $4,383 |
Source: Public Records
Map
Nearby Homes
- 2 Hickory Bluff Rd
- 02 Hickory Bluff Rd
- 1 Hickory Bluff Rd
- 3056 Hickory Bluff Rd
- 9043 S 152nd West Ave
- 21 Johnson Dr
- 1203 Johnson Dr
- 2000 W Taft Ave
- 13632 W 122nd St S
- 00 Sahoma Lake Rd
- 1755 S Stephanie St
- 1515 Emily Cir
- 1401 Panther Ln
- 1776 S Stephanie St
- 1330 Panther Ln
- 10541 Sahoma Lake Rd
- 10 Sahoma Lake Rd
- 13545 Dusty Trail
- 4244 N Spocogee St
- 1522 N Spocogee St
- 2815 Hickory Bluff Rd
- 2831 Hickory Bluff Rd
- 2879 Hickory Bluff Rd
- 3069 Hickory Bluff Rd
- 01 Hickory Bluff Rd
- 2807 Hickory Bluff Rd
- 2909 Hickory Bluff Rd
- 2765 Hickory Bluff Rd
- 2917 Hickory Bluff Rd
- 2925 Hickory Bluff Rd
- 2749 Hickory Bluff Rd
- 2933 S Hickory St
- 2900 Hickory Bluff Rd
- 2933 Hickory Bluff Rd
- 2724 Hickory Bluff Rd
- 2705 Hickory Bluff Rd
- 2718 Hickory Bluff Rd
- 2636 Hickory Bluff Rd
- 2635 Hickory Bluff Rd
- 208 Mose Meadows Rd