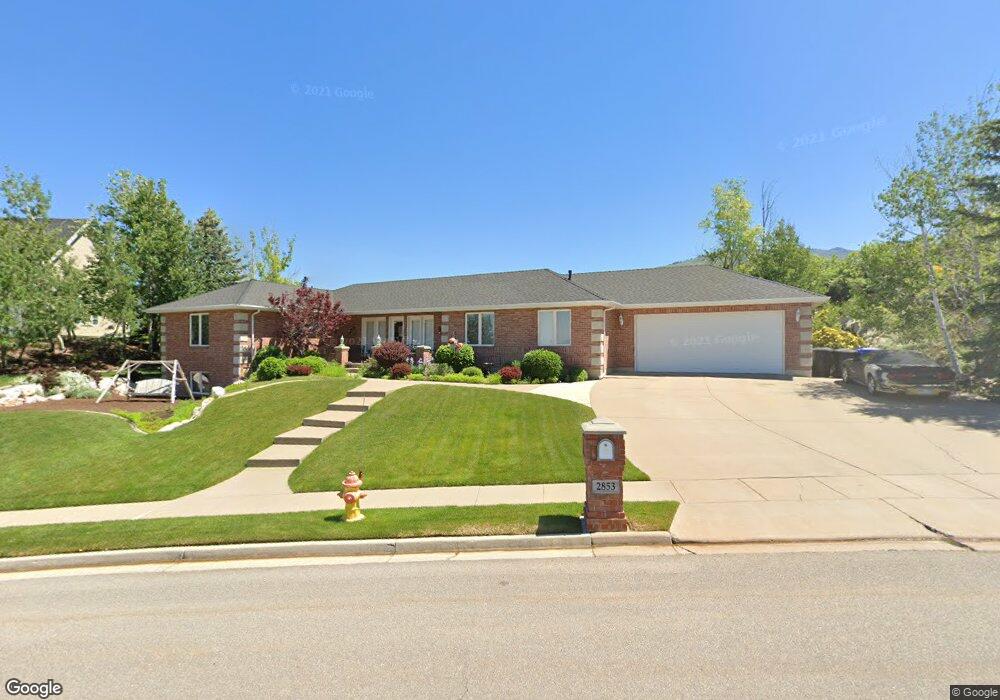
2853 Maple Cove Dr Bountiful, UT 84010
Estimated Value: $697,000 - $907,230
3
Beds
3
Baths
4,333
Sq Ft
$195/Sq Ft
Est. Value
About This Home
This home is located at 2853 Maple Cove Dr, Bountiful, UT 84010 and is currently estimated at $843,808, approximately $194 per square foot. 2853 Maple Cove Dr is a home located in Davis County with nearby schools including Valley View School, Mueller Park Junior High School, and Bountiful High School.
Ownership History
Date
Name
Owned For
Owner Type
Purchase Details
Closed on
Aug 16, 2024
Sold by
Falkner Judith L
Bought by
Falkner Bradley J and Falkner Judith L
Current Estimated Value
Home Financials for this Owner
Home Financials are based on the most recent Mortgage that was taken out on this home.
Original Mortgage
$28,500
Outstanding Balance
$22,697
Interest Rate
6.89%
Mortgage Type
New Conventional
Estimated Equity
$821,111
Purchase Details
Closed on
Nov 13, 2003
Sold by
Bingman Frederick S and Bingman Dorothy N
Bought by
Falkner Bradley J and Falkner Judith L
Home Financials for this Owner
Home Financials are based on the most recent Mortgage that was taken out on this home.
Original Mortgage
$250,000
Interest Rate
5.72%
Mortgage Type
Purchase Money Mortgage
Create a Home Valuation Report for This Property
The Home Valuation Report is an in-depth analysis detailing your home's value as well as a comparison with similar homes in the area
Purchase History
| Date | Buyer | Sale Price | Title Company |
|---|---|---|---|
| Falkner Bradley J | -- | Cottonwood Title | |
| Falkner Judith L | -- | Cottonwood Title | |
| Falkner Bradley J | -- | Paramount Title Corp |
Source: Public Records
Mortgage History
| Date | Status | Borrower | Loan Amount |
|---|---|---|---|
| Open | Falkner Judith L | $28,500 | |
| Previous Owner | Falkner Bradley J | $250,000 |
Source: Public Records
Tax History
| Year | Tax Paid | Tax Assessment Tax Assessment Total Assessment is a certain percentage of the fair market value that is determined by local assessors to be the total taxable value of land and additions on the property. | Land | Improvement |
|---|---|---|---|---|
| 2025 | $4,297 | $427,900 | $182,591 | $245,309 |
| 2024 | $3,995 | $404,250 | $230,961 | $173,289 |
| 2023 | $3,999 | $732,000 | $271,699 | $460,301 |
| 2022 | $4,064 | $407,550 | $145,878 | $261,672 |
| 2021 | $3,695 | $568,000 | $214,177 | $353,823 |
| 2020 | $3,189 | $496,000 | $199,005 | $296,995 |
| 2019 | $3,253 | $494,000 | $205,884 | $288,116 |
| 2018 | $3,069 | $461,000 | $207,554 | $253,446 |
| 2016 | $2,726 | $217,580 | $62,556 | $155,024 |
| 2015 | $2,787 | $214,665 | $62,556 | $152,109 |
| 2014 | $2,818 | $211,200 | $62,556 | $148,644 |
| 2013 | -- | $181,500 | $89,945 | $91,555 |
Source: Public Records
Map
Nearby Homes
- 1676 E Mueller Park Rd
- 0 Bountiful Blvd
- 1820 S High Pointe Dr
- 1987 Mapleview Dr
- 2091 Windsor Park Cir
- 1878 E Ridge Point Dr
- 1475 Mueller Park Rd
- 1785 1450 E Unit 604
- 1735 S Temple Ct Unit 203
- 2136 Elaine Dr
- 1596 E Millbrook Way
- 3252 Sunset Hollow Dr
- 1087 Arlington Way
- 842 E 2150 S
- 4031 Mountain Oaks Dr Unit 308
- 626 E 2150 S
- 438 Indian Springs Rd
- 631 E 1700 S
- 424 E Canyon Estates Dr S
- 1886 S Jeri Dr
- 2881 S Maple Cove Dr
- 2815 S Maple Cove Dr
- 2815 Maple Cove Dr
- 2848 Maple Cove Ln Unit 19
- 2888 Maple Cove Dr Unit 20
- 2911 Maple Cove Dr
- 2888 Maple Cove Dr
- 2888 Maple Cove Dr Unit 20
- 2806 Maple Cove Dr
- 1681 Maple Hills Dr Unit 1
- 1681 Maple Hills Dr
- 2867 Cove Ln
- 2933 Maple Cove Dr
- 2843 Cove Ln
- 2763 Cove Ln Unit 4
- 2763 Cove Ln
- 2948 Maple Cove Dr
- 2941 Maple Cove Dr
- 2941 Maple Cove Dr Unit 21
- 2797 Cove Ln
Your Personal Tour Guide
Ask me questions while you tour the home.