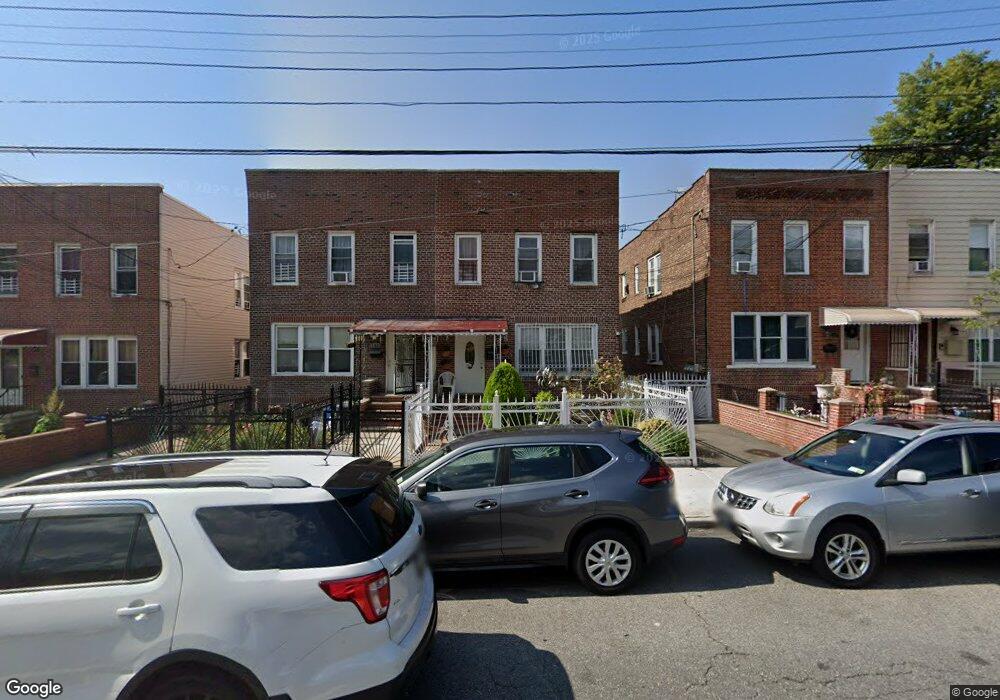
2853 Randall Ave Bronx, NY 10465
Throgs Neck-Edgewater Park NeighborhoodEstimated Value: $618,139 - $800,000
--
Bed
--
Bath
1,664
Sq Ft
$437/Sq Ft
Est. Value
About This Home
This home is located at 2853 Randall Ave, Bronx, NY 10465 and is currently estimated at $726,535, approximately $436 per square foot. 2853 Randall Ave is a home located in Bronx County with nearby schools including P.S. 14 Senator John Calandra, Herbert H Lehman High School, and St Benedict School.
Ownership History
Date
Name
Owned For
Owner Type
Purchase Details
Closed on
Dec 22, 2004
Sold by
Duran Luis
Bought by
Duran Eladia and Duran Luis
Current Estimated Value
Purchase Details
Closed on
Jun 19, 2003
Sold by
Marquez Santiago
Bought by
Duran Luis
Purchase Details
Closed on
Nov 4, 1999
Sold by
Cuffy Renwick and Cuffy Joyce
Bought by
Marquez Santiago
Home Financials for this Owner
Home Financials are based on the most recent Mortgage that was taken out on this home.
Original Mortgage
$196,200
Interest Rate
8.15%
Purchase Details
Closed on
Feb 2, 1998
Sold by
Kelly Thomas P and Garrahan Laura R
Bought by
Cuffy Renwick and Cuffy Joyce
Home Financials for this Owner
Home Financials are based on the most recent Mortgage that was taken out on this home.
Original Mortgage
$178,600
Interest Rate
7.09%
Create a Home Valuation Report for This Property
The Home Valuation Report is an in-depth analysis detailing your home's value as well as a comparison with similar homes in the area
Home Values in the Area
Average Home Value in this Area
Purchase History
| Date | Buyer | Sale Price | Title Company |
|---|---|---|---|
| Duran Eladia | -- | -- | |
| Duran Eladia | -- | -- | |
| Duran Luis | $295,000 | -- | |
| Duran Luis | $295,000 | -- | |
| Marquez Santiago | $218,000 | -- | |
| Marquez Santiago | $218,000 | -- | |
| Cuffy Renwick | $188,000 | Commonwealth Land Title Ins | |
| Cuffy Renwick | $188,000 | Commonwealth Land Title Ins |
Source: Public Records
Mortgage History
| Date | Status | Borrower | Loan Amount |
|---|---|---|---|
| Previous Owner | Marquez Santiago | $196,200 | |
| Previous Owner | Cuffy Renwick | $178,600 | |
| Closed | Duran Luis | $0 |
Source: Public Records
Tax History Compared to Growth
Tax History
| Year | Tax Paid | Tax Assessment Tax Assessment Total Assessment is a certain percentage of the fair market value that is determined by local assessors to be the total taxable value of land and additions on the property. | Land | Improvement |
|---|---|---|---|---|
| 2025 | $6,557 | $36,720 | $8,398 | $28,322 |
| 2024 | $6,557 | $36,444 | $7,813 | $28,631 |
| 2023 | $6,323 | $34,381 | $7,460 | $26,921 |
| 2022 | $6,188 | $41,760 | $9,660 | $32,100 |
| 2021 | $6,137 | $35,520 | $9,660 | $25,860 |
| 2020 | $6,181 | $36,060 | $9,660 | $26,400 |
| 2019 | $6,060 | $37,200 | $9,660 | $27,540 |
| 2018 | $5,543 | $28,651 | $8,193 | $20,458 |
| 2017 | $5,210 | $27,030 | $8,337 | $18,693 |
| 2016 | $4,788 | $25,500 | $9,660 | $15,840 |
| 2015 | $3,019 | $26,856 | $10,683 | $16,173 |
| 2014 | $3,019 | $26,653 | $10,602 | $16,051 |
Source: Public Records
Map
Nearby Homes
- 710 Revere Ave
- 2864 Philip Ave
- 2866 Philip Ave
- 2887 Lamport Place
- - Ave
- 2808 Philip Ave
- 836 Revere Ave
- 755 Logan Ave
- 730 Logan Ave
- 831 Swinton Ave
- 837 Swinton Ave
- 731 Hollywood Ave
- 2965 Schley Ave
- 724 Hollywood Ave
- 819 Hollywood Ave
- 840 Hollywood Ave
- 449 Revere Ave
- 525 Hollywood Ave
- 512 Logan Ave
- 945 Swinton Ave
- 2857 Randall Ave
- 2851 Randall Ave
- 2859 Randall Ave
- 2849 Randall Ave
- 711 Revere Ave
- 2847 Randall Ave
- 713 Revere Ave
- 2843 Randall Ave
- 710 Calhoun Ave
- 717 Revere Ave Unit 1
- 717 Revere Ave
- 712 Calhoun Ave
- 2841 Randall Ave
- 2861 Randall Ave
- 719 Revere Ave
- 2863 Randall Ave
- 718 Calhoun Ave
- 721 Revere Ave
- 2867 Randall Ave
- 720 Calhoun Ave