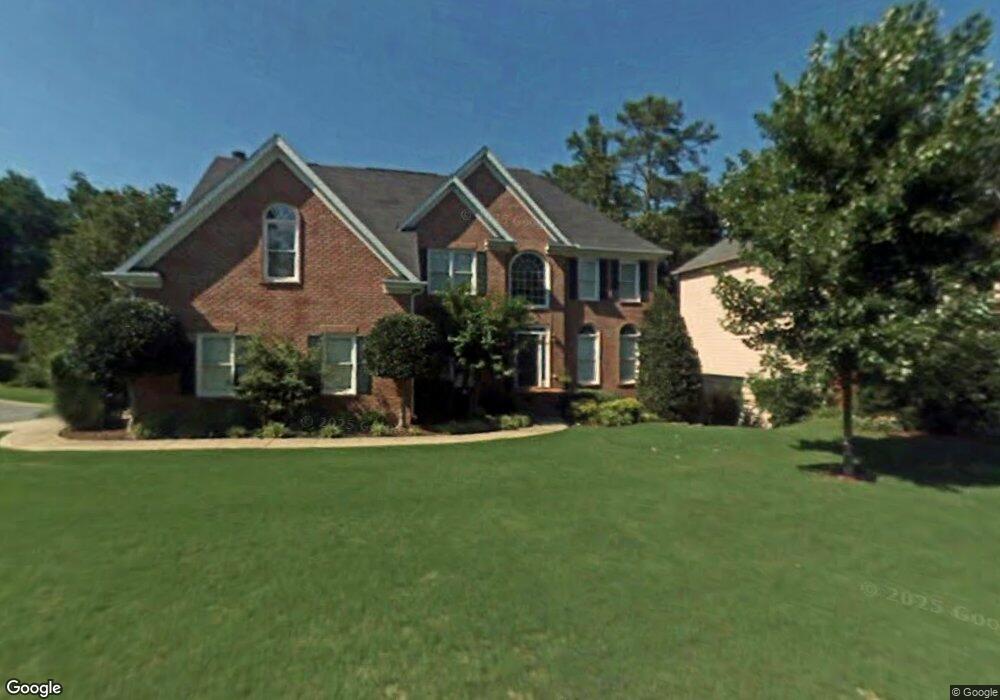
2854 Tynewick Dr NE Unit 3 Roswell, GA 30075
East Cobb NeighborhoodEstimated Value: $732,987 - $912,000
4
Beds
3
Baths
2,939
Sq Ft
$270/Sq Ft
Est. Value
About This Home
This home is located at 2854 Tynewick Dr NE Unit 3, Roswell, GA 30075 and is currently estimated at $792,747, approximately $269 per square foot. 2854 Tynewick Dr NE Unit 3 is a home located in Cobb County with nearby schools including Tritt Elementary School, Hightower Trail Middle School, and Pope High School.
Ownership History
Date
Name
Owned For
Owner Type
Purchase Details
Closed on
Mar 29, 2013
Sold by
Wadella John Roger
Bought by
Carlton Catherine A and Carlton Jerry G
Current Estimated Value
Home Financials for this Owner
Home Financials are based on the most recent Mortgage that was taken out on this home.
Original Mortgage
$324,000
Outstanding Balance
$228,431
Interest Rate
3.52%
Mortgage Type
New Conventional
Estimated Equity
$564,316
Purchase Details
Closed on
Dec 3, 1996
Sold by
Keith Jones Bldrs Inc
Bought by
Wadella John R Elizabeth
Create a Home Valuation Report for This Property
The Home Valuation Report is an in-depth analysis detailing your home's value as well as a comparison with similar homes in the area
Home Values in the Area
Average Home Value in this Area
Purchase History
| Date | Buyer | Sale Price | Title Company |
|---|---|---|---|
| Carlton Catherine A | $405,000 | -- | |
| Wadella John R Elizabeth | $247,500 | -- |
Source: Public Records
Mortgage History
| Date | Status | Borrower | Loan Amount |
|---|---|---|---|
| Open | Carlton Catherine A | $324,000 | |
| Closed | Wadella John R Elizabeth | $0 |
Source: Public Records
Tax History Compared to Growth
Tax History
| Year | Tax Paid | Tax Assessment Tax Assessment Total Assessment is a certain percentage of the fair market value that is determined by local assessors to be the total taxable value of land and additions on the property. | Land | Improvement |
|---|---|---|---|---|
| 2025 | $7,227 | $292,284 | $70,000 | $222,284 |
| 2024 | $7,233 | $292,284 | $70,000 | $222,284 |
| 2023 | $6,227 | $270,952 | $60,000 | $210,952 |
| 2022 | $5,516 | $211,288 | $48,000 | $163,288 |
| 2021 | $5,516 | $211,288 | $48,000 | $163,288 |
| 2020 | $5,049 | $189,940 | $44,000 | $145,940 |
| 2019 | $5,049 | $189,940 | $44,000 | $145,940 |
| 2018 | $5,049 | $189,940 | $44,000 | $145,940 |
| 2017 | $4,309 | $165,316 | $44,000 | $121,316 |
| 2016 | $4,313 | $165,316 | $44,000 | $121,316 |
| 2015 | $4,192 | $155,396 | $44,000 | $111,396 |
| 2014 | $4,225 | $155,396 | $0 | $0 |
Source: Public Records
Map
Nearby Homes
- 2859 Tynewick Dr NE
- 2696 Long Lake Terrace NE
- 110 Boulder Dr
- 2990 Mountain Trace NE
- 230 Tynebrae Place Unit 1
- 2655 Boulder Creek Dr NE
- 2482 N Forest Dr
- 5108 Nicolet Ct
- 2661 Sandpoint Way NE
- 1365 Ridgefield Dr
- 1215 Ridgefield Dr
- 3025 Creek Ct NE
- 1533 Tennessee Walker Dr NE
- 3333 Trails End Rd NE
- 980 Pine Grove Rd
- 4574 Woodland Cir NE
- 5103 Tynewick Trace NE
- 5100 Tynewick Trace NE
- 0 Tynewick Dr
- 2857 Tynewick Dr NE
- 5102 Tynewick Trace NE
- 2861 Tynewick Dr NE Unit 3
- 2863 Tynewick Dr NE
- 5107 Tynewick Trace NE Unit 3
- 5231 Tealing Dr NE
- 5104 Tynewick Trace NE
- 2855 Tynewick Dr NE
- 5232 Tealing Dr NE Unit IV
- 2865 Tynewick Dr NE Unit 3
- 5229 Tealing Dr NE Unit 4
- 5089 Overlook Dr NE Unit 2
- 5087 Overlook Dr NE
- 5106 Tynewick Trace NE
- 5230 Tealing Dr NE
- 2853 Tynewick Dr NE
- 2858 Tynewick Dr NE