Estimated Value: $409,542 - $425,000
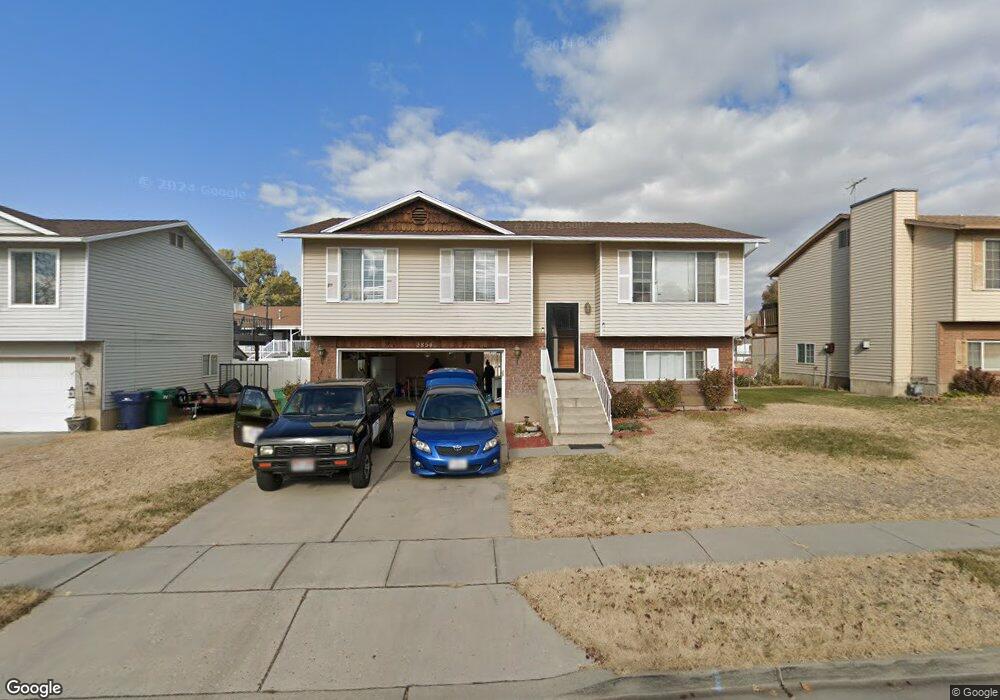
3
Beds
2
Baths
1,676
Sq Ft
$251/Sq Ft
Est. Value
About This Home
This home is located at 2854 W 5975 S, Roy, UT 84067 and is currently estimated at $420,136, approximately $250 per square foot. 2854 W 5975 S is a home located in Weber County with nearby schools including Roy Elementary School, Roy Junior High School, and Roy High School.
Ownership History
Date
Name
Owned For
Owner Type
Purchase Details
Closed on
Oct 18, 2019
Sold by
Juarez Miguel and Medina Elidia Alarcon
Bought by
Juarez Miguel and Medina Elidia Alarcon
Current Estimated Value
Home Financials for this Owner
Home Financials are based on the most recent Mortgage that was taken out on this home.
Original Mortgage
$233,689
Outstanding Balance
$203,197
Interest Rate
3.25%
Mortgage Type
FHA
Estimated Equity
$216,939
Purchase Details
Closed on
Oct 8, 2019
Sold by
Juarez Miguel
Bought by
Juarez Miguel and Medina Elidia Alacorn
Home Financials for this Owner
Home Financials are based on the most recent Mortgage that was taken out on this home.
Original Mortgage
$233,689
Outstanding Balance
$203,197
Interest Rate
3.25%
Mortgage Type
FHA
Estimated Equity
$216,939
Purchase Details
Closed on
Sep 17, 2019
Sold by
Nguyen Dau V and Vo Alice N
Bought by
Juarez Miguel
Home Financials for this Owner
Home Financials are based on the most recent Mortgage that was taken out on this home.
Original Mortgage
$233,689
Outstanding Balance
$203,197
Interest Rate
3.25%
Mortgage Type
FHA
Estimated Equity
$216,939
Create a Home Valuation Report for This Property
The Home Valuation Report is an in-depth analysis detailing your home's value as well as a comparison with similar homes in the area
Home Values in the Area
Average Home Value in this Area
Purchase History
| Date | Buyer | Sale Price | Title Company |
|---|---|---|---|
| Juarez Miguel | -- | Stewart Title Ins Agcy Of Ut | |
| Juarez Miguel | -- | Stewart Title Ins Agcy Of | |
| Juarez Miguel | -- | Real Advantage Title Ins Ag |
Source: Public Records
Mortgage History
| Date | Status | Borrower | Loan Amount |
|---|---|---|---|
| Open | Juarez Miguel | $233,689 |
Source: Public Records
Tax History
| Year | Tax Paid | Tax Assessment Tax Assessment Total Assessment is a certain percentage of the fair market value that is determined by local assessors to be the total taxable value of land and additions on the property. | Land | Improvement |
|---|---|---|---|---|
| 2025 | $2,515 | $396,950 | $111,997 | $284,953 |
| 2024 | $2,454 | $214,499 | $61,598 | $152,901 |
| 2023 | $2,369 | $207,350 | $63,811 | $143,539 |
| 2022 | $2,523 | $228,800 | $55,037 | $173,763 |
| 2021 | $1,992 | $295,000 | $71,367 | $223,633 |
| 2020 | $1,875 | $255,000 | $71,367 | $183,633 |
| 2019 | $1,771 | $226,000 | $42,082 | $183,918 |
| 2018 | $1,670 | $200,000 | $40,146 | $159,854 |
| 2017 | $1,533 | $171,000 | $40,146 | $130,854 |
| 2016 | $1,543 | $93,035 | $20,272 | $72,763 |
| 2015 | $1,345 | $82,057 | $20,272 | $61,785 |
| 2014 | $1,338 | $80,736 | $20,272 | $60,464 |
Source: Public Records
Map
Nearby Homes
Your Personal Tour Guide
Ask me questions while you tour the home.