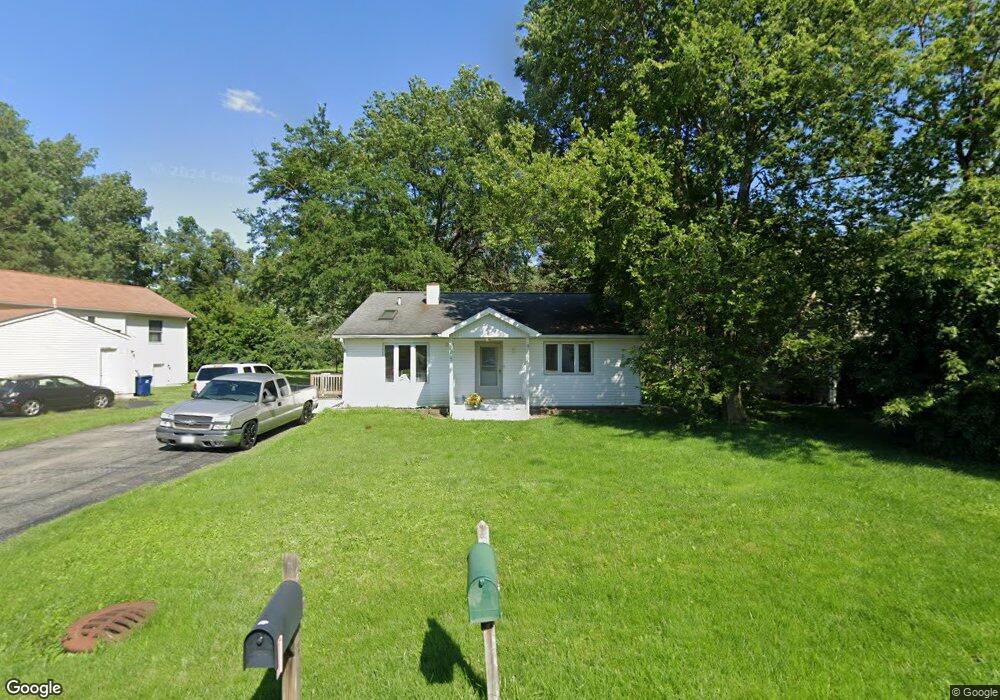
28547 N Monroe St Wauconda, IL 60084
Estimated Value: $255,283 - $304,000
3
Beds
2
Baths
1,029
Sq Ft
$276/Sq Ft
Est. Value
About This Home
This home is located at 28547 N Monroe St, Wauconda, IL 60084 and is currently estimated at $284,321, approximately $276 per square foot. 28547 N Monroe St is a home located in Lake County with nearby schools including Wauconda Grade School, Wauconda Middle School, and Wauconda High School.
Ownership History
Date
Name
Owned For
Owner Type
Purchase Details
Closed on
Aug 7, 2009
Sold by
Us Bank National Association
Bought by
Hay Kaylan M and Johnson Peter
Current Estimated Value
Home Financials for this Owner
Home Financials are based on the most recent Mortgage that was taken out on this home.
Original Mortgage
$137,362
Outstanding Balance
$90,062
Interest Rate
5.32%
Mortgage Type
FHA
Estimated Equity
$194,259
Purchase Details
Closed on
May 9, 2009
Sold by
Denaleck Jose0ph De
Bought by
Us Bank National Association and Bafc 2006-7
Purchase Details
Closed on
Oct 30, 2001
Sold by
Sinks Lucille
Bought by
Naleck Joseph D and Naleck Isolde I
Home Financials for this Owner
Home Financials are based on the most recent Mortgage that was taken out on this home.
Original Mortgage
$170,266
Interest Rate
6.69%
Mortgage Type
FHA
Create a Home Valuation Report for This Property
The Home Valuation Report is an in-depth analysis detailing your home's value as well as a comparison with similar homes in the area
Home Values in the Area
Average Home Value in this Area
Purchase History
| Date | Buyer | Sale Price | Title Company |
|---|---|---|---|
| Hay Kaylan M | $150,000 | Ticor | |
| Us Bank National Association | -- | None Available | |
| Naleck Joseph D | $173,000 | -- |
Source: Public Records
Mortgage History
| Date | Status | Borrower | Loan Amount |
|---|---|---|---|
| Open | Hay Kaylan M | $137,362 | |
| Previous Owner | Naleck Joseph D | $170,266 |
Source: Public Records
Tax History Compared to Growth
Tax History
| Year | Tax Paid | Tax Assessment Tax Assessment Total Assessment is a certain percentage of the fair market value that is determined by local assessors to be the total taxable value of land and additions on the property. | Land | Improvement |
|---|---|---|---|---|
| 2024 | $4,329 | $67,214 | $19,969 | $47,245 |
| 2023 | $4,316 | $61,439 | $18,253 | $43,186 |
| 2022 | $4,316 | $53,994 | $12,802 | $41,192 |
| 2021 | $4,108 | $51,020 | $12,097 | $38,923 |
| 2020 | $3,955 | $48,628 | $11,530 | $37,098 |
| 2019 | $3,443 | $45,958 | $10,897 | $35,061 |
| 2018 | $4,212 | $50,410 | $16,630 | $33,780 |
| 2017 | $4,202 | $49,827 | $16,438 | $33,389 |
| 2016 | $3,973 | $47,184 | $15,566 | $31,618 |
| 2015 | $3,797 | $43,316 | $14,290 | $29,026 |
| 2014 | $3,892 | $43,539 | $13,945 | $29,594 |
| 2012 | $3,799 | $45,642 | $13,342 | $32,300 |
Source: Public Records
Map
Nearby Homes
- 0 Bonner Rd
- 28722 N Madison Ave
- 1260 Water Stone Cir
- 28855 N Garland Rd
- 701 Lake Shore Dr
- 29564 N Garland Rd
- 28177 N Garland Rd
- 26049 N Il Route 59
- 26241 W Bonner Rd
- 419 Hill St Unit 2805
- 136 Parkview Dr Unit 5136
- 225 Regency Ct Unit A
- 302 Stillwater Ct Unit 1702
- 303 Stillwater Ct Unit 1106
- 309 Stillwater Ct Unit 1101
- 235 Regency Ct Unit B
- 315 Hill St Unit A
- 240 Regency Ct
- 325 Sundown Ct Unit B
- 310 Sundown Ct Unit E
- 28567 N Monroe St
- 25372 W Bonner Rd
- 25380 W Bonner Rd
- 28573 N Monroe St
- 25364 W Bonner Rd
- 28575 N Monroe St
- 25418 W Bonner Rd
- 28538 N Monroe St
- 28574 N Monroe St
- 28566 N Monroe St
- 25426 W Bonner Rd
- 804 E Bonner Rd
- 28558 N Jackson Ave
- 28584 N Monroe St
- 28520 N Jackson Ave
- 28598 N Monroe St
- 25430 W Bonner Rd
- 808 E Bonner Rd
- 722 E Bonner Rd
- 814 E Bonner Rd