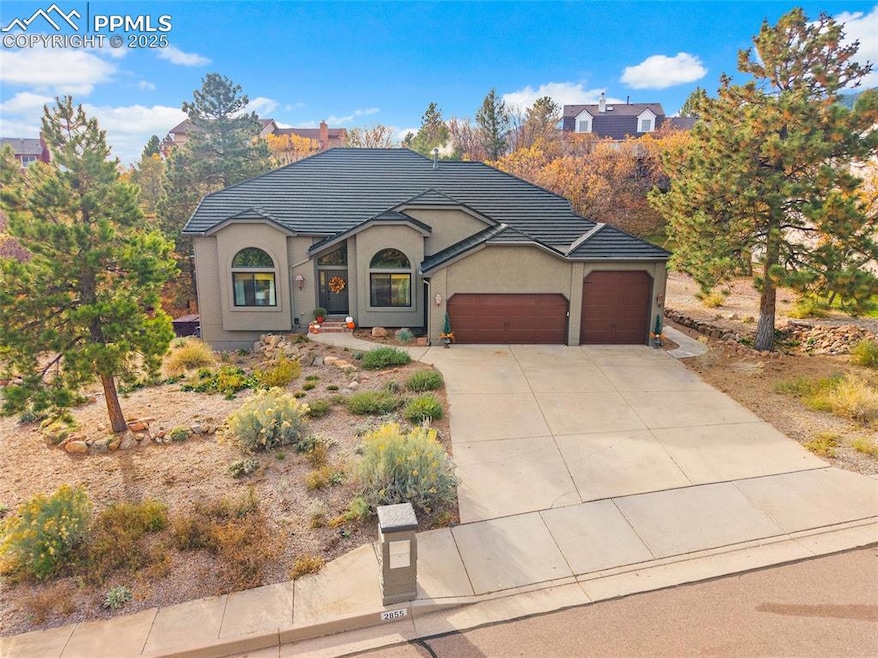
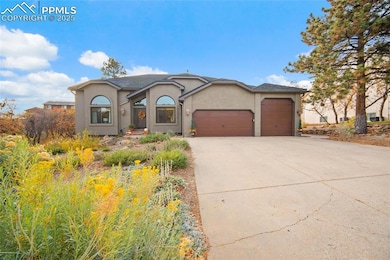
2855 Halleys Ct Colorado Springs, CO 80906
Skyway NeighborhoodEstimated payment $6,887/month
Highlights
- Mountain View
- Property is near a park
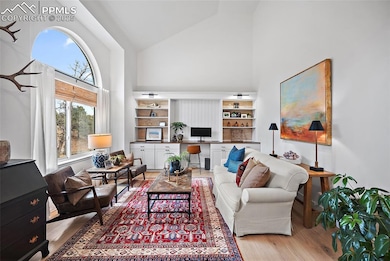
- Vaulted Ceiling
- Gold Camp Elementary School Rated A
- Multiple Fireplaces
- Wood Flooring
About This Home
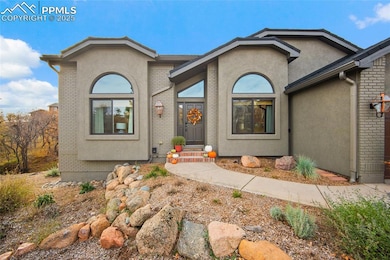
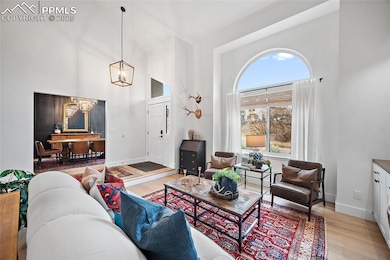
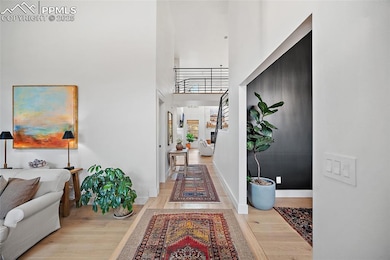
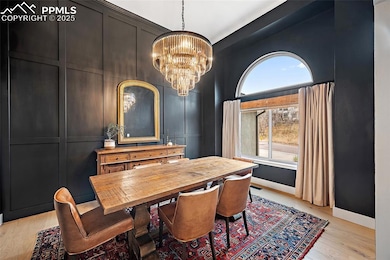
Contemporary showstopper lovingly brought to vibrant life offers a transformative living experience of style and comfort. There isn't a surface that hasn't been touched in this comprehensive renovation inside and out. Dramatic main-level living spaces with palatial ceiling heights and a soaring fireplace blend with a calm and homey atmosphere that make it feel as though you've nested in a work of art. Bright and inviting, you'll want to stay in the gorgeous front parlor, but the entrance draws you in to an open floor plan that leads to an endless chef's kitchen with breakfast banquette for morning coffee or intimate get-togethers with a close friend. The formal dining room has been reimagined into a space of tranquility and class. A main-level master suite brings into the picture a five-piece bath with iron tub and Carrera marble tile. Upstairs, enjoy the views below from the airy landing, which leads to three spacious bedrooms, one en suite, and a second hall bath, all of which have been updated to modern expectations. Downstairs is a whole other world: a cozy family room with a second fireplace, a large wet bar for entertaining that lies just inside from a hot tub, a suite of two exercise rooms, an office/craft room, and a secluded guest suite with a bath that would be the pride of the home anywhere else, including a sauna. Outside, the home has new paint and a new roof in 2025, and the length-of-the-house deck has been replaced with composite decking. Xeriscaped landscaping makes yard maintenance easy. With a four-car tandem garage complete with RV parking, a large pantry and main-level laundry, the home has all the extra conveniences that make this home complete. Tucked on the slopes of upper Skyway with a trailhead just around the corner and Bear Creek Park just down the hill, the location is ideal for outdoor activities.
Home Details
Home Type
- Single Family
Est. Annual Taxes
- $3,321
Year Built
- Built in 1990
Lot Details
- 0.47 Acre Lot
- Landscaped
- Level Lot
HOA Fees
- $8 Monthly HOA Fees
Parking
- 4 Car Attached Garage
- Tandem Garage
- Garage Door Opener
- Driveway
Home Design
- Brick Exterior Construction
- Stucco
Interior Spaces
- 5,291 Sq Ft Home
- 1.5-Story Property
- Vaulted Ceiling
- Multiple Fireplaces
- Gas Fireplace
- French Doors
- Great Room
- Mountain Views
Kitchen
- Oven
- Down Draft Cooktop
- Microwave
- Dishwasher
- Disposal
- Instant Hot Water
Flooring
- Wood
- Ceramic Tile
- Luxury Vinyl Tile
Bedrooms and Bathrooms
- 5 Bedrooms
- Main Floor Bedroom
Laundry
- Dryer
- Washer
Basement
- Basement Fills Entire Space Under The House
- Fireplace in Basement
Location
- Property is near a park
- Property is near schools
Utilities
- Forced Air Heating and Cooling System
- Heating System Uses Natural Gas
Community Details
Recreation
- Hiking Trails
Map
Home Values in the Area
Average Home Value in this Area
Tax History
| Year | Tax Paid | Tax Assessment Tax Assessment Total Assessment is a certain percentage of the fair market value that is determined by local assessors to be the total taxable value of land and additions on the property. | Land | Improvement |
|---|---|---|---|---|
| 2025 | $3,321 | $58,350 | -- | -- |
| 2024 | $3,221 | $51,810 | $12,060 | $39,750 |
| 2023 | $3,221 | $51,810 | $12,060 | $39,750 |
| 2022 | $2,469 | $36,240 | $11,020 | $25,220 |
| 2021 | $2,107 | $37,270 | $11,330 | $25,940 |
| 2020 | $1,950 | $34,320 | $9,440 | $24,880 |
| 2019 | $1,928 | $34,320 | $9,440 | $24,880 |
| 2018 | $1,692 | $30,610 | $11,230 | $19,380 |
| 2017 | $1,685 | $30,610 | $11,230 | $19,380 |
| 2016 | $1,703 | $32,250 | $11,940 | $20,310 |
| 2015 | $1,699 | $32,250 | $11,940 | $20,310 |
| 2014 | $1,533 | $29,860 | $11,460 | $18,400 |
Property History
| Date | Event | Price | List to Sale | Price per Sq Ft |
|---|---|---|---|---|
| 11/13/2025 11/13/25 | For Sale | $1,250,000 | -- | $236 / Sq Ft |
Purchase History
| Date | Type | Sale Price | Title Company |
|---|---|---|---|
| Personal Reps Deed | $815,000 | Guardian Ttl & Guaranty Agcy | |
| Deed | $195,100 | -- | |
| Deed | $32,000 | -- | |
| Deed | -- | -- | |
| Deed | -- | -- |
Mortgage History
| Date | Status | Loan Amount | Loan Type |
|---|---|---|---|
| Open | $548,250 | New Conventional |
Source: Pikes Peak REALTOR® Services
MLS Number: 9941597
APN: 74221-06-007
Disclaimer: Certain information contained herein is derived from information provided by parties other than Homes.com. All information provided is deemed reliable, but is not guaranteed to be accurate and should be independently verified.
![]() IDX information is provided exclusively for personal, non-commercial use, and may not be used for any purpose other than to identify prospective properties consumers may be interested in purchasing. Information is deemed reliable but not guaranteed.
IDX information is provided exclusively for personal, non-commercial use, and may not be used for any purpose other than to identify prospective properties consumers may be interested in purchasing. Information is deemed reliable but not guaranteed.
- 506 Orion Place
- 2771 Rigel Dr
- 2437 Virgo Dr
- 2419 Astron Dr
- 2706 Veteran Heights
- 625 Vista Grande Dr
- 705 Orion Dr
- 2560 Wheaton Dr
- 707 Orion Dr
- 2025 Lone Willow View
- 480 Bear Creek Place
- 1989 Lone Willow View
- 1971 Lone Willow View Unit 45
- 1971 Lone Willow View
- 125 Mountain Spirit Point
- 2915 Pegasus Dr
- 1426 Westend Ave
- 85 Mountain Spirit Point
- 2302 Hercules Dr
- 264 Pecan Garden View
- 1311 Westend Ave
- 1030 Market St Unit A
- 2112 Boston Terrace
- 1173 Solitaire St
- 280 Gold Claim Terrace
- 706 S 25th St Unit A
- 1402 W Costilla St
- 1025 W Cimarron St
- 954 W Moreno Ave
- 1735 Presidential Heights
- 2415 W Vermijo Ave
- 2125 W Colorado Ave Unit 2125 W Colorado Ave
- 1621 W Colorado Ave Unit b
- 2409 W Colorado Ave
- 2409 W Colorado Ave
- 2409 W Colorado Ave
- 2409 W Colorado Ave
- 2605 W Pikes Peak Ave Unit 15
- 1120 W Colorado Ave
- 2626 W Pikes Peak Ave
