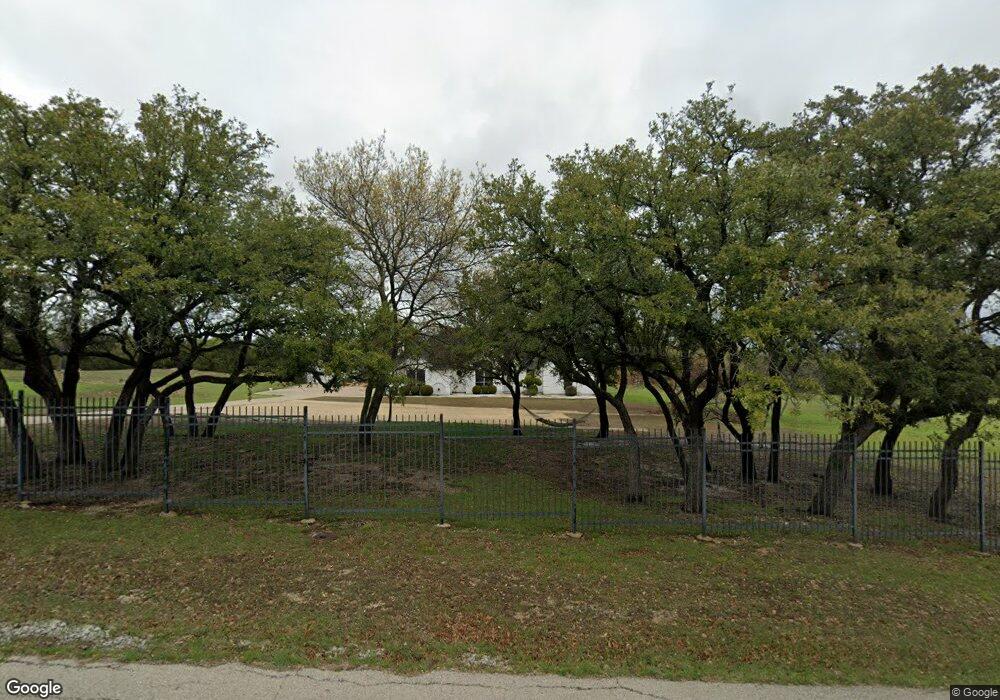
2855 Sonora Canyon Rd Weatherford, TX 76087
Estimated Value: $467,000 - $548,000
--
Bed
--
Bath
2,268
Sq Ft
$221/Sq Ft
Est. Value
About This Home
This home is located at 2855 Sonora Canyon Rd, Weatherford, TX 76087 and is currently estimated at $500,765, approximately $220 per square foot. 2855 Sonora Canyon Rd is a home located in Parker County with nearby schools including Martin Elementary School, Tison Middle School, and Weatherford High School.
Ownership History
Date
Name
Owned For
Owner Type
Purchase Details
Closed on
Nov 14, 2013
Sold by
Rice Andrea
Bought by
Rice Eric F and Rice Eric Forrest
Current Estimated Value
Home Financials for this Owner
Home Financials are based on the most recent Mortgage that was taken out on this home.
Original Mortgage
$60,000
Interest Rate
4.34%
Mortgage Type
Seller Take Back
Purchase Details
Closed on
Dec 28, 2005
Sold by
Robbins Randall R and Robbins Laura J
Bought by
Rice Eric F and Rice Andrea E
Home Financials for this Owner
Home Financials are based on the most recent Mortgage that was taken out on this home.
Original Mortgage
$25,490
Interest Rate
6.2%
Mortgage Type
Stand Alone Second
Purchase Details
Closed on
May 6, 1997
Bought by
Rice Eric F
Purchase Details
Closed on
May 5, 1997
Bought by
Rice Eric F
Purchase Details
Closed on
Mar 24, 1989
Bought by
Rice Eric F
Create a Home Valuation Report for This Property
The Home Valuation Report is an in-depth analysis detailing your home's value as well as a comparison with similar homes in the area
Home Values in the Area
Average Home Value in this Area
Purchase History
| Date | Buyer | Sale Price | Title Company |
|---|---|---|---|
| Rice Eric F | -- | None Available | |
| Rice Eric F | -- | None Available | |
| Rice Eric F | -- | -- | |
| Rice Eric F | -- | -- | |
| Rice Eric F | -- | -- |
Source: Public Records
Mortgage History
| Date | Status | Borrower | Loan Amount |
|---|---|---|---|
| Closed | Rice Eric F | $60,000 | |
| Open | Rice Eric F | $234,555 | |
| Closed | Rice Eric F | $25,490 | |
| Closed | Rice Eric F | $203,900 |
Source: Public Records
Tax History Compared to Growth
Tax History
| Year | Tax Paid | Tax Assessment Tax Assessment Total Assessment is a certain percentage of the fair market value that is determined by local assessors to be the total taxable value of land and additions on the property. | Land | Improvement |
|---|---|---|---|---|
| 2025 | $4,705 | $327,620 | -- | -- |
| 2024 | $4,705 | $297,836 | -- | -- |
| 2023 | $4,705 | $270,760 | $0 | $0 |
| 2022 | $5,460 | $246,150 | $53,390 | $192,760 |
| 2021 | $5,911 | $246,150 | $53,390 | $192,760 |
| 2020 | $5,573 | $235,410 | $42,650 | $192,760 |
| 2019 | $5,355 | $235,410 | $42,650 | $192,760 |
| 2018 | $4,890 | $190,630 | $31,720 | $158,910 |
| 2017 | $5,016 | $190,630 | $31,720 | $158,910 |
| 2016 | $4,941 | $187,780 | $31,570 | $156,210 |
| 2015 | $4,070 | $187,780 | $31,570 | $156,210 |
| 2014 | $3,724 | $156,620 | $27,590 | $129,030 |
Source: Public Records
Map
Nearby Homes
- 2712 Sonora Canyon Rd
- 705 N Oakridge Dr
- 302 Red Eagle Trail
- 1629 Silverstone Dr
- 1624 Sandle Wood Dr
- 1636 Salado Trail
- 1529 Sidewinder Trail
- 1605 Stanchion Way
- 1553 Salado Trail
- 1520 Sidewinder Trail
- 1525 Sand Dollar Trail
- 1541 Stanchion Way
- TBA N Oakridge Dr
- 106 Rambling Trail
- 221 Valley Ranch Rd
- 808 W Lake Dr
- 2911 Inspiration Dr
- 2517 Hayley Dr
- 3609 Marina Link
- 100 Coronado Trail
- 3005 Sonora Canyon Rd
- 2715 Sonora Canyon Rd
- 3000 Sonora Canyon Rd
- 2714 Sonora Canyon Rd
- 2718 Sonora Canyon Rd
- 3013 Sonora Canyon Rd
- 2710 Sonora Canyon Rd
- 2734 White Settlement Rd
- 2726 White Settlement Rd
- 2816 White Settlement Rd
- 2708 Sonora Canyon Rd
- 2815 Pittman Rd
- 2730 White Settlement Rd
- 2706 Sonora Canyon Rd
- 2704 Sonora Canyon Rd
- 2819 Pittman Rd
- 2989 Sonora Canyon Rd
- 2702 Sonora Canyon Rd
- 712 N Oakridge Dr
- 2720 White Settlement Rd