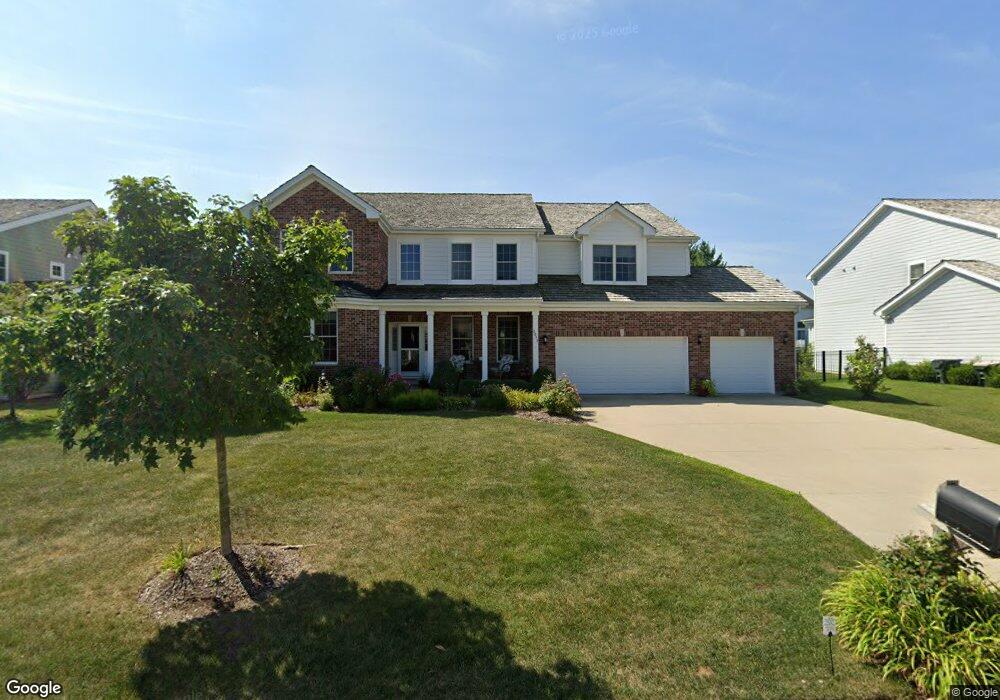
2855 Trail Crest Ln Lindenhurst, IL 60046
Estimated Value: $688,000 - $818,000
4
Beds
3
Baths
3,037
Sq Ft
$248/Sq Ft
Est. Value
About This Home
This home is located at 2855 Trail Crest Ln, Lindenhurst, IL 60046 and is currently estimated at $754,176, approximately $248 per square foot. 2855 Trail Crest Ln is a home located in Lake County with nearby schools including Millburn Elementary School, Millburn Middle School, and Lakes Community High School.
Ownership History
Date
Name
Owned For
Owner Type
Purchase Details
Closed on
Jul 28, 2017
Sold by
Caldwell Michelle
Bought by
Caldwell Michelle L and Trust No 2855
Current Estimated Value
Purchase Details
Closed on
Jun 30, 2014
Sold by
William Ryan Homes Inc
Bought by
Caldwell Michelle
Home Financials for this Owner
Home Financials are based on the most recent Mortgage that was taken out on this home.
Original Mortgage
$388,000
Outstanding Balance
$296,534
Interest Rate
4.25%
Mortgage Type
New Conventional
Estimated Equity
$457,642
Purchase Details
Closed on
Dec 4, 2012
Sold by
Jd Lindenhurst Llc
Bought by
William Ryan Homes Inc
Purchase Details
Closed on
Apr 26, 2011
Sold by
Landmark Homes Of Providence Ridge Llc
Bought by
Jd Lindenhurst Llc
Create a Home Valuation Report for This Property
The Home Valuation Report is an in-depth analysis detailing your home's value as well as a comparison with similar homes in the area
Home Values in the Area
Average Home Value in this Area
Purchase History
| Date | Buyer | Sale Price | Title Company |
|---|---|---|---|
| Caldwell Michelle L | -- | Attorney | |
| Caldwell Michelle | $485,000 | Fidelity National Title Ins | |
| William Ryan Homes Inc | $85,000 | Security First Title Co | |
| Jd Lindenhurst Llc | $275,000 | First American Title |
Source: Public Records
Mortgage History
| Date | Status | Borrower | Loan Amount |
|---|---|---|---|
| Open | Caldwell Michelle | $388,000 |
Source: Public Records
Tax History
| Year | Tax Paid | Tax Assessment Tax Assessment Total Assessment is a certain percentage of the fair market value that is determined by local assessors to be the total taxable value of land and additions on the property. | Land | Improvement |
|---|---|---|---|---|
| 2024 | $19,948 | $209,793 | $20,739 | $189,054 |
| 2023 | $24,118 | $185,362 | $18,324 | $167,038 |
| 2022 | $24,118 | $184,613 | $20,086 | $164,527 |
| 2021 | $23,297 | $171,494 | $18,659 | $152,835 |
| 2020 | $22,494 | $165,999 | $18,061 | $147,938 |
| 2019 | $22,578 | $159,538 | $17,358 | $142,180 |
| 2018 | $21,530 | $162,467 | $25,207 | $137,260 |
| 2017 | $20,902 | $158,134 | $24,535 | $133,599 |
| 2016 | $25,582 | $185,044 | $28,131 | $156,913 |
| 2015 | $24,479 | $172,825 | $26,273 | $146,552 |
| 2014 | $179 | $62,950 | $1,317 | $61,633 |
| 2012 | $160 | $1,323 | $1,323 | $0 |
Source: Public Records
Map
Nearby Homes
- 3210 Neubauer Cir
- 1406 Neubauer Cir Unit 1904
- 2303 Neubauer Cir Unit 312
- 19135 W Millburn Rd
- 2375 Kelsey Ct
- 2407 Valley Dr
- 73 S Beck Rd
- 200 S Beck Rd Unit 12
- 622 Oxford Ct
- 961 Sumac Ct
- 2879 Falling Waters Dr
- 394 Northgate Rd
- 697 Providence Ln
- 412 Northgate Rd Unit 27
- 543 Sparrow Ct
- 2798 Spring Cir S
- 2792 Spring Cir S
- 533 N Beck Rd Unit 28
- 1906 Fairfield Rd
- 1903 Hazelwood Dr
- 2845 Trail Crest Ln
- 79 Saint Marys Ln
- 83 Saint Marys Ln
- 79 St Marys Ln
- 89 Saint Marys Ln
- 2835 Trail Crest Ln
- 2860 Trail Crest Ln
- 2850 Trail Crest Ln
- 73 Saint Marys Ln
- 2870 Trail Crest Ln
- 2840 Trail Crest Ln
- 93 Saint Marys Ln
- 2885 Trail Crest Ln
- 2880 Trail Crest Ln
- 69 Saint Marys Ln
- 2830 Trail Crest Ln
- 96 Hackney Ln
- 72 Saint Marys Ln
- 87 Bridlepath Dr
- 63 Saint Marys Ln
Your Personal Tour Guide
Ask me questions while you tour the home.