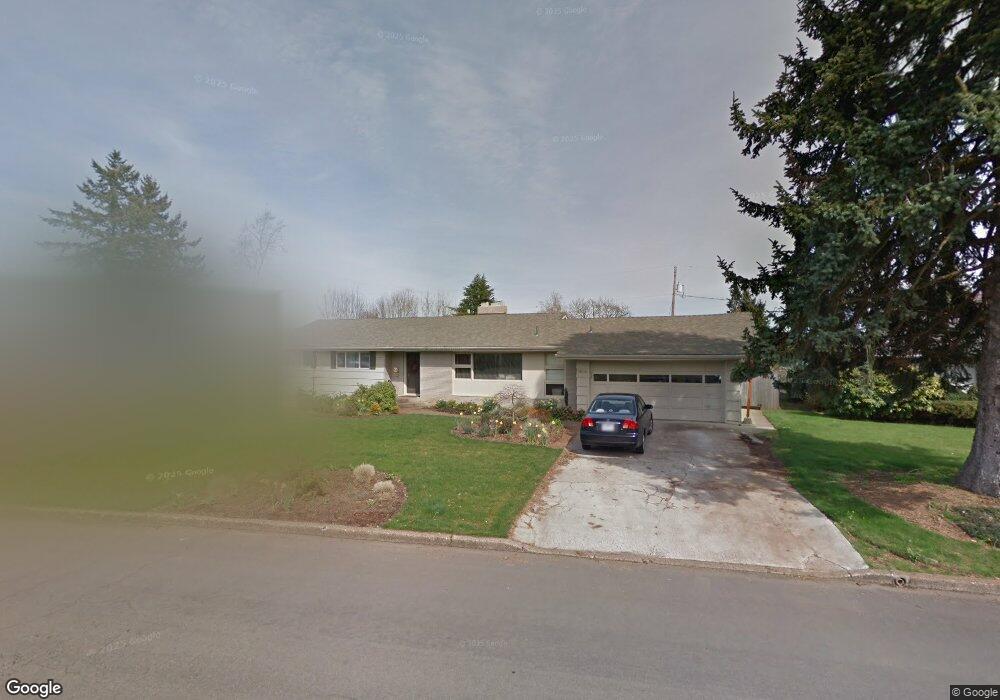
2856 Argyle Dr S Salem, OR 97302
South Salem NeighborhoodEstimated Value: $465,000 - $491,000
3
Beds
3
Baths
1,787
Sq Ft
$266/Sq Ft
Est. Value
About This Home
This home is located at 2856 Argyle Dr S, Salem, OR 97302 and is currently estimated at $475,189, approximately $265 per square foot. 2856 Argyle Dr S is a home located in Marion County with nearby schools including Candalaria Elementary School, Leslie Middle School, and South Salem High School.
Ownership History
Date
Name
Owned For
Owner Type
Purchase Details
Closed on
Apr 27, 2017
Sold by
Mangum Charles E and Mangum Carol A
Bought by
Childers Kelby D and Mangum Childers Laura E
Current Estimated Value
Home Financials for this Owner
Home Financials are based on the most recent Mortgage that was taken out on this home.
Original Mortgage
$245,962
Outstanding Balance
$203,728
Interest Rate
4.3%
Mortgage Type
FHA
Estimated Equity
$271,461
Purchase Details
Closed on
Oct 27, 2009
Sold by
Plews Evan and Goodier David
Bought by
Mangum Charles E and Mangum Carol A
Purchase Details
Closed on
Apr 25, 2008
Sold by
Forrest Todd R
Bought by
Forrest Pamela D and Forrest Living Trust
Purchase Details
Closed on
Apr 24, 2008
Sold by
Forrest Pamela D
Bought by
Plews Evan and Goodier David
Purchase Details
Closed on
Jun 12, 2007
Sold by
Forrest Lydia D
Bought by
Forrest Pamela D and Forrest Living Trust
Create a Home Valuation Report for This Property
The Home Valuation Report is an in-depth analysis detailing your home's value as well as a comparison with similar homes in the area
Home Values in the Area
Average Home Value in this Area
Purchase History
| Date | Buyer | Sale Price | Title Company |
|---|---|---|---|
| Childers Kelby D | $250,500 | Fidelity Natl Title Co Of Or | |
| Mangum Charles E | $244,000 | Fidelity Natl Title Co Of Or | |
| Forrest Pamela D | -- | Ticor Title | |
| Plews Evan | $198,000 | Ticor Title | |
| Forrest Pamela D | -- | Ticor Title | |
| Forrest Pamela D | -- | None Available |
Source: Public Records
Mortgage History
| Date | Status | Borrower | Loan Amount |
|---|---|---|---|
| Open | Childers Kelby D | $245,962 |
Source: Public Records
Tax History
| Year | Tax Paid | Tax Assessment Tax Assessment Total Assessment is a certain percentage of the fair market value that is determined by local assessors to be the total taxable value of land and additions on the property. | Land | Improvement |
|---|---|---|---|---|
| 2025 | $4,700 | $246,560 | -- | -- |
| 2024 | $4,700 | $239,380 | -- | -- |
| 2023 | $4,561 | $232,410 | $0 | $0 |
| 2022 | $4,301 | $225,650 | $0 | $0 |
| 2021 | $4,178 | $219,080 | $0 | $0 |
| 2020 | $4,249 | $222,810 | $0 | $0 |
| 2019 | $4,100 | $216,330 | $0 | $0 |
| 2018 | $4,172 | $0 | $0 | $0 |
| 2017 | $3,766 | $0 | $0 | $0 |
| 2016 | $3,587 | $0 | $0 | $0 |
| 2015 | $3,614 | $0 | $0 | $0 |
| 2014 | $3,498 | $0 | $0 | $0 |
Source: Public Records
Map
Nearby Homes
- 560 Hansen Ave S
- 340 Boice St S
- 635 Missouri Ave S
- 790 Hansen Ave S
- 3240 Cooke St S
- 3250 Earhart St S
- 820 W Vista Ave S
- 3302 Felton St S
- 3321 Felton St S
- 160 Salem Heights Ave S
- 3282 Felton St S
- 3232 Granada Way S
- 390 Salem Heights Ave S
- 875 Caroline St S
- 3370 Argyle Dr S
- 210 Hoyt St S
- 2724 Prominent Ct S
- 480 Ohmart Ave SE
- 2839 Church St SE
- 2765 Prominent Ct S
- 2860 Argyle Dr S
- 2850 Argyle Dr S
- 2845 Mountain View Dr S
- 2815 Mountain View Dr S
- 2885 Mountain View Dr S
- 2880 Argyle Dr S
- 2800 Mountain View Dr S Unit BLK
- 2890 Argyle Dr S
- 2805 Argyle Dr S
- 2780 Argyle Dr S
- 2845 Argyle Dr S
- 6625 Argyle Dr S
- 2795 Mountain View Dr S
- 2865 Argyle Dr S
- 2895 Mountain View Dr S
- 2915 Argyle Dr S
- 440 Ben Vista Dr S
- 2840 Mountain View Dr S
- 2765 Mountain View Dr S
- 390 Hansen Ave S
Your Personal Tour Guide
Ask me questions while you tour the home.