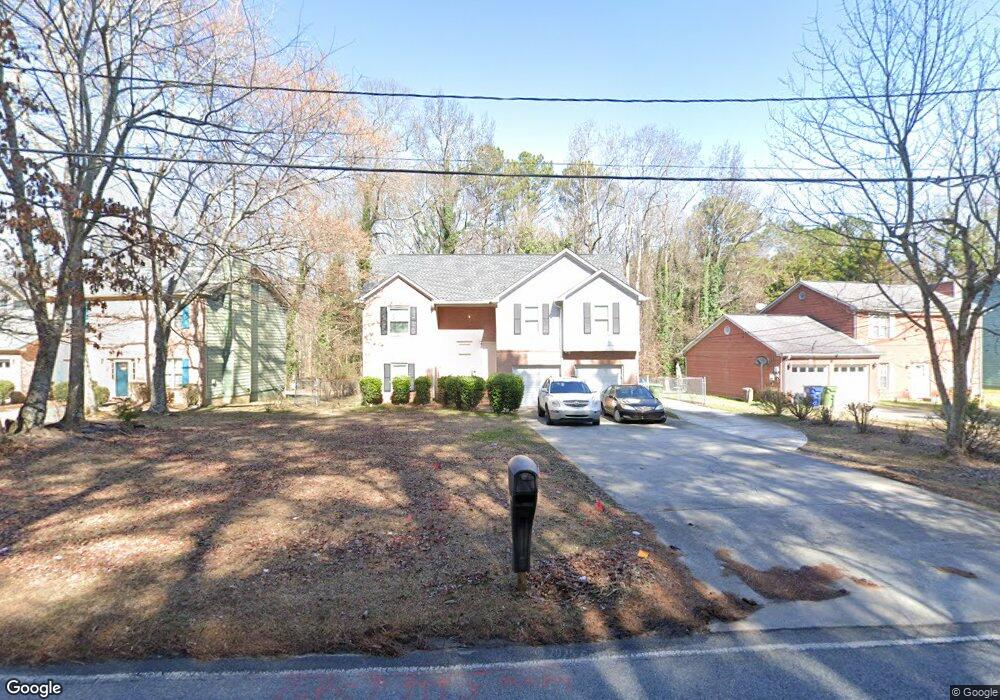
2856 Fairburn Rd SW Unit 5 Atlanta, GA 30331
Ben Hill NeighborhoodEstimated Value: $274,000 - $420,000
5
Beds
3
Baths
2,202
Sq Ft
$157/Sq Ft
Est. Value
About This Home
This home is located at 2856 Fairburn Rd SW Unit 5, Atlanta, GA 30331 and is currently estimated at $346,581, approximately $157 per square foot. 2856 Fairburn Rd SW Unit 5 is a home located in Fulton County with nearby schools including Deerwood Academy School, Bunche Middle School, and Therrell High School.
Ownership History
Date
Name
Owned For
Owner Type
Purchase Details
Closed on
Apr 30, 2015
Sold by
Stembridge Charlie
Bought by
Johnson Zernetha
Current Estimated Value
Home Financials for this Owner
Home Financials are based on the most recent Mortgage that was taken out on this home.
Original Mortgage
$130,492
Outstanding Balance
$100,962
Interest Rate
3.8%
Mortgage Type
FHA
Estimated Equity
$245,619
Purchase Details
Closed on
Jul 26, 2010
Sold by
Stembridge Charlie F
Bought by
Stembridge Charlie and Stembridge Sharon
Home Financials for this Owner
Home Financials are based on the most recent Mortgage that was taken out on this home.
Original Mortgage
$111,200
Interest Rate
4.61%
Mortgage Type
New Conventional
Purchase Details
Closed on
Dec 31, 1997
Sold by
Brittian Willie F
Bought by
Stembridge Charlie F
Home Financials for this Owner
Home Financials are based on the most recent Mortgage that was taken out on this home.
Original Mortgage
$112,500
Interest Rate
7.18%
Mortgage Type
New Conventional
Create a Home Valuation Report for This Property
The Home Valuation Report is an in-depth analysis detailing your home's value as well as a comparison with similar homes in the area
Home Values in the Area
Average Home Value in this Area
Purchase History
| Date | Buyer | Sale Price | Title Company |
|---|---|---|---|
| Johnson Zernetha | $132,900 | -- | |
| Stembridge Charlie | -- | -- | |
| Stembridge Charlie F | $125,000 | -- |
Source: Public Records
Mortgage History
| Date | Status | Borrower | Loan Amount |
|---|---|---|---|
| Open | Johnson Zernetha | $130,492 | |
| Previous Owner | Stembridge Charlie | $111,200 | |
| Previous Owner | Stembridge Charlie F | $112,500 |
Source: Public Records
Tax History Compared to Growth
Tax History
| Year | Tax Paid | Tax Assessment Tax Assessment Total Assessment is a certain percentage of the fair market value that is determined by local assessors to be the total taxable value of land and additions on the property. | Land | Improvement |
|---|---|---|---|---|
| 2025 | $2,275 | $115,880 | $27,480 | $88,400 |
| 2023 | $3,779 | $91,280 | $13,680 | $77,600 |
| 2022 | $1,418 | $91,280 | $13,680 | $77,600 |
| 2021 | $1,378 | $90,720 | $8,960 | $81,760 |
| 2020 | $1,341 | $89,600 | $8,840 | $80,760 |
| 2019 | $499 | $88,040 | $8,680 | $79,360 |
| 2018 | $1,904 | $85,960 | $8,480 | $77,480 |
| 2017 | $900 | $53,160 | $7,160 | $46,000 |
| 2016 | $897 | $53,160 | $7,160 | $46,000 |
| 2015 | $928 | $38,000 | $5,120 | $32,880 |
| 2014 | $413 | $38,000 | $5,120 | $32,880 |
Source: Public Records
Map
Nearby Homes
- 3964 Riverchess Dr SW
- 3812 Kathryn Dr SW
- 2805 Alexandria Dr SW
- 2959 Fairburn Rd SW
- 3814 N Camp Creek Pkwy SW
- 4001 Riverchess Dr SW
- Britton Plan at Tell River
- Clifton Plan at Tell River
- Wynbrooke 4 Bedroom Plan at Tell River
- 2707 SW Riverpine Lot 178 Trail SW
- 3028 Deerborne Ct SW
- 2873 Deerwood Dr SW
- 4037 Riverchess Dr SW
- 3730 Stephanie Dr SW
- 3825 Hempstead Way
- 3640 Narron Dr SW
- 3153 Daleview Way SW
- 2836 Darrah Dr SW
- 2973 Cambridge Dr SW
- 2870 Fairburn Rd SW
- 2870 Fairburn Rd SW
- 2842 Fairburn Rd SW
- 2828 Fairburn Rd SW Unit 7
- 2828 Fairburn Rd SW
- 2874 Fairburn Rd SW
- 2853 Fairburn Rd SW
- 2845 Fairburn Rd SW
- 2814 Fairburn Rd SW
- 2886 Fairburn Rd SW
- 2886 Fairburn Rd SW Unit 2
- 2849 Fairburn Rd SW
- 2804 Fairburn Rd SW
- 2859 Fairburn Rd SW
- 2888 Fairburn Rd SW
- 2869 Fairburn Rd SW
- 2800 Fairburn Rd SW
- 3960 Riverchess Dr SW
- 2863 Fairburn Rd SW