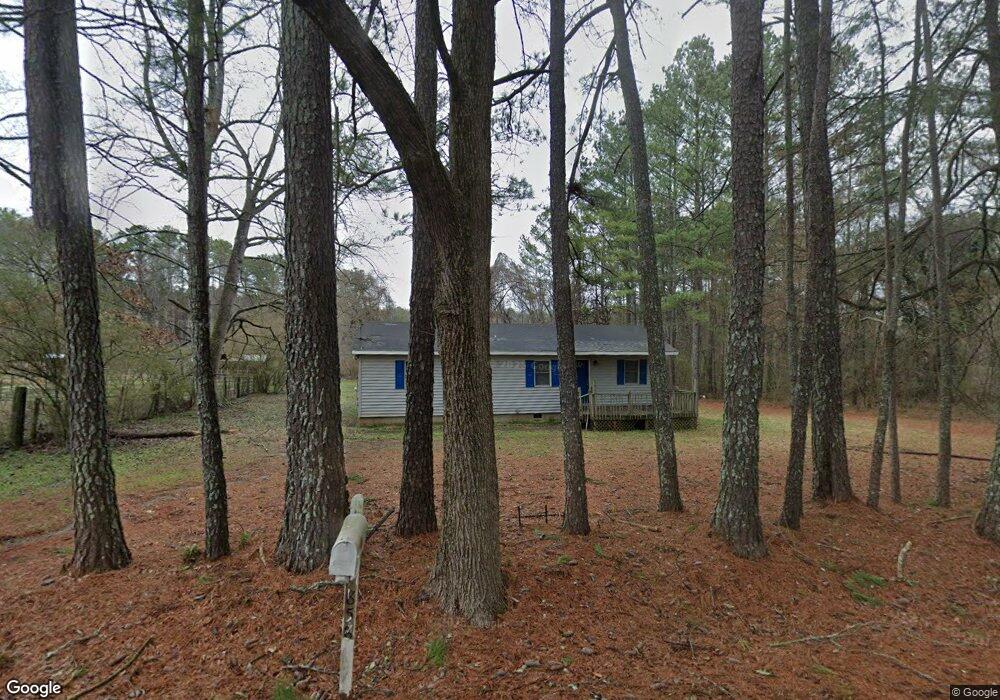
2858 Coffer Dr Ellenwood, GA 30294
Estimated Value: $155,000 - $197,000
3
Beds
2
Baths
1,072
Sq Ft
$163/Sq Ft
Est. Value
About This Home
This home is located at 2858 Coffer Dr, Ellenwood, GA 30294 and is currently estimated at $174,469, approximately $162 per square foot. 2858 Coffer Dr is a home located in Clayton County with nearby schools including Anderson Elementary School, Adamson Middle School, and Morrow High School.
Ownership History
Date
Name
Owned For
Owner Type
Purchase Details
Closed on
Sep 1, 2005
Sold by
King Two Ents Inc
Bought by
Jones Elma A
Current Estimated Value
Home Financials for this Owner
Home Financials are based on the most recent Mortgage that was taken out on this home.
Original Mortgage
$94,500
Outstanding Balance
$50,144
Interest Rate
5.72%
Mortgage Type
New Conventional
Estimated Equity
$124,325
Purchase Details
Closed on
Jan 26, 2005
Sold by
Jennings Jack S
Bought by
King Two Enterprises Inc
Purchase Details
Closed on
Apr 26, 2000
Sold by
Turner Wash Sr
Bought by
Jennings Jack S
Home Financials for this Owner
Home Financials are based on the most recent Mortgage that was taken out on this home.
Original Mortgage
$47,952
Interest Rate
8.14%
Mortgage Type
FHA
Purchase Details
Closed on
Aug 2, 1994
Sold by
Lee James C Janice S
Bought by
Credit Depot Corp
Create a Home Valuation Report for This Property
The Home Valuation Report is an in-depth analysis detailing your home's value as well as a comparison with similar homes in the area
Home Values in the Area
Average Home Value in this Area
Purchase History
| Date | Buyer | Sale Price | Title Company |
|---|---|---|---|
| Jones Elma A | $105,000 | -- | |
| King Two Enterprises Inc | -- | -- | |
| Jennings Jack S | $47,500 | -- | |
| Credit Depot Corp | $18,500 | -- | |
| Credit Depot Corp | $18,500 | -- |
Source: Public Records
Mortgage History
| Date | Status | Borrower | Loan Amount |
|---|---|---|---|
| Open | Jones Elma A | $94,500 | |
| Previous Owner | Jennings Jack S | $47,952 |
Source: Public Records
Tax History Compared to Growth
Tax History
| Year | Tax Paid | Tax Assessment Tax Assessment Total Assessment is a certain percentage of the fair market value that is determined by local assessors to be the total taxable value of land and additions on the property. | Land | Improvement |
|---|---|---|---|---|
| 2024 | $1,735 | $44,480 | $5,120 | $39,360 |
| 2023 | $1,616 | $44,760 | $5,120 | $39,640 |
| 2022 | $1,429 | $36,400 | $5,120 | $31,280 |
| 2021 | $1,201 | $30,400 | $5,120 | $25,280 |
| 2020 | $1,412 | $35,315 | $10,000 | $25,315 |
| 2019 | $1,380 | $34,004 | $10,000 | $24,004 |
| 2018 | $1,225 | $30,165 | $10,000 | $20,165 |
| 2017 | $1,009 | $24,792 | $10,000 | $14,792 |
| 2016 | $1,079 | $26,508 | $10,000 | $16,508 |
| 2015 | $1,069 | $0 | $0 | $0 |
| 2014 | $1,026 | $25,787 | $10,000 | $15,787 |
Source: Public Records
Map
Nearby Homes
- 2840 Ellenwood Village Way
- 4020 Grant Rd
- 2748 Village Park Dr E
- 2817 Village Park Dr E
- 2802 Village Park Dr E
- 2728 Lower Village Dr
- 4026 Villagewood Ln
- 4034 Villagewood Ln
- 3891 Village Crossing Ln
- 3028 Wentworth Ave
- 4111 Village Crossing Cir
- 3027 Wentworth Ave
- 3819 Village Crossing Ln
- 2264 Silver Maple Cir Unit 176
- 2309 Pine View Trail
- 4425 Boulder Springs Cove
- 4179 Williamson Rd
- 2878 Coffer Dr
- 2838 Coffer Dr
- 2887 Coffer Dr
- 2849 Coffer Dr
- 2898 Coffer Dr
- 2817 Coffer Dr
- 2812 Coffer Dr
- 2904 Coffer Dr
- 2864 Ellenwood Village Way Unit LOT 135
- 2848 Ellenwood Village Way
- 2880 Ellenwood Village Way
- 2888 Ellenwood Village Way
- 2914 Coffer Dr
- 2856 Ellenwood Village Way
- 2872 Ellenwood Village Way
- 2904 Ellenwood Village Way
- 2918 Coffer Dr
- 2785 Old Field Rd
- 0 Ellenwood Village Way Unit 8646091
- 0 Ellenwood Village Way Unit 8565753