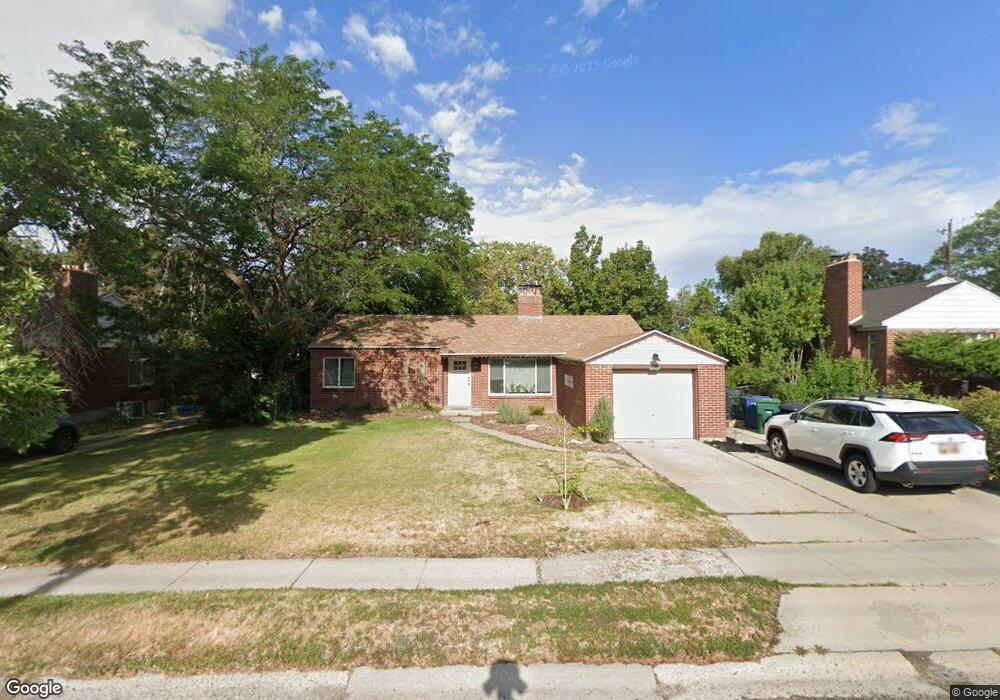
2858 S 2700 E Salt Lake City, UT 84109
Canyon Rim NeighborhoodEstimated Value: $631,000 - $696,939
3
Beds
2
Baths
1,194
Sq Ft
$557/Sq Ft
Est. Value
About This Home
This home is located at 2858 S 2700 E, Salt Lake City, UT 84109 and is currently estimated at $664,985, approximately $556 per square foot. 2858 S 2700 E is a home located in Salt Lake County with nearby schools including Rosecrest Elementary School, Evergreen Junior High School, and Olympus High School.
Ownership History
Date
Name
Owned For
Owner Type
Purchase Details
Closed on
Sep 3, 2021
Sold by
Charles Hembrough Dale
Bought by
Dale Hembrough Revocable Living Trust
Current Estimated Value
Home Financials for this Owner
Home Financials are based on the most recent Mortgage that was taken out on this home.
Original Mortgage
$331,500
Outstanding Balance
$301,190
Interest Rate
2.7%
Mortgage Type
Commercial
Estimated Equity
$363,795
Purchase Details
Closed on
Sep 27, 2020
Sold by
Hembrough Dale C
Bought by
Hembrough Dale Charles and Hembrough Dale Revocable
Purchase Details
Closed on
Sep 6, 2002
Sold by
Zajac Family Enterprises Ltd
Bought by
Hembrough Dale C
Home Financials for this Owner
Home Financials are based on the most recent Mortgage that was taken out on this home.
Original Mortgage
$112,000
Interest Rate
6.29%
Create a Home Valuation Report for This Property
The Home Valuation Report is an in-depth analysis detailing your home's value as well as a comparison with similar homes in the area
Home Values in the Area
Average Home Value in this Area
Purchase History
| Date | Buyer | Sale Price | Title Company |
|---|---|---|---|
| Dale Hembrough Revocable Living Trust | -- | -- | |
| Rocky Mountain Property Holdings Llc | -- | Eagle Gate Title Ins Agcy | |
| Dale Hembrough Revocable Living Trust | -- | -- | |
| Hembrough Dale Charles | -- | Eagle Gate Title Ins Agcy | |
| Hembrough Dale C | -- | First American Title |
Source: Public Records
Mortgage History
| Date | Status | Borrower | Loan Amount |
|---|---|---|---|
| Open | Rocky Mountain Property Holdings Llc | $331,500 | |
| Previous Owner | Hembrough Dale C | $112,000 |
Source: Public Records
Tax History Compared to Growth
Tax History
| Year | Tax Paid | Tax Assessment Tax Assessment Total Assessment is a certain percentage of the fair market value that is determined by local assessors to be the total taxable value of land and additions on the property. | Land | Improvement |
|---|---|---|---|---|
| 2025 | $3,557 | $606,500 | $269,700 | $336,800 |
| 2024 | $3,557 | $569,500 | $261,300 | $308,200 |
| 2023 | $3,538 | $546,800 | $229,200 | $317,600 |
| 2022 | $2,883 | $426,600 | $224,800 | $201,800 |
| 2021 | $2,555 | $344,100 | $172,900 | $171,200 |
| 2020 | $2,318 | $294,700 | $167,900 | $126,800 |
| 2019 | $2,159 | $268,100 | $158,400 | $109,700 |
| 2018 | $2,049 | $245,000 | $158,400 | $86,600 |
| 2017 | $1,889 | $236,700 | $158,400 | $78,300 |
| 2016 | $1,671 | $211,400 | $158,400 | $53,000 |
| 2015 | $1,749 | $207,100 | $161,500 | $45,600 |
| 2014 | $1,761 | $203,900 | $158,400 | $45,500 |
Source: Public Records
Map
Nearby Homes
- 2861 S 2700 E
- 2835 S 2475 E
- 9556 E 2655 S Unit 34
- 9556 E 2655 S Unit 35
- 3133 S 2700 E
- 2963 S Grace St
- 3050 S Grace St
- 2776 E 3220 S
- 2290 E 2700 S
- 2221 E Fisher Ln
- 3094 S 2300 E
- 2780 E 3300 S
- 2236 E Vimont Ave
- 2660 E 3300 S Unit A21
- 2267 E 2700 S
- 2428 Scenic Dr E
- 2471 Scenic Dr E
- 2457 Scenic Dr E
- 2203 E Vimont Ave
- 2532 Maywood Dr
- 2850 S 2700 E
- 2866 S 2700 E
- 2865 Wainwright Rd
- 2874 S 2700 E
- 2859 Wainwright Rd
- 2859 S Wainwright Rd
- 2688 Barbey Dr
- 2678 Barbey Dr
- 2688 E Barbey Dr
- 2877 Wainwright Rd
- 2853 S 2700 E
- 2672 Barbey Dr
- 2882 S 2700 E
- 2849 Wainwright Rd
- 2881 S Wainwright Rd
- 2881 Wainwright Rd
- 2871 S 2700 E
- 2851 S 2700 E
- 2664 Barbey Dr
- 2841 S 2700 E