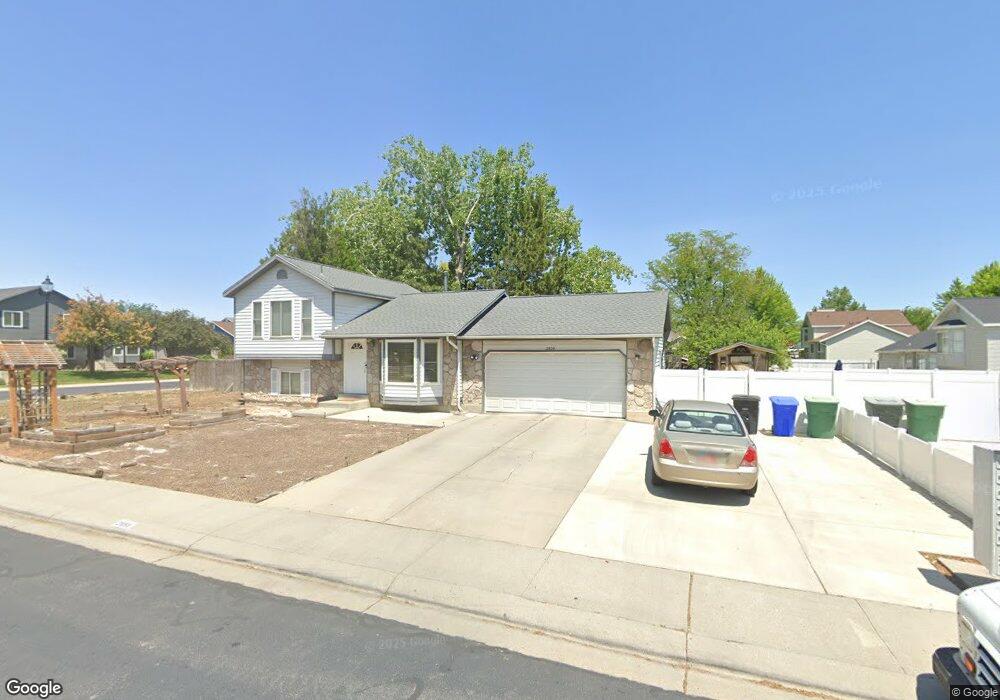
2858 Strawberry Loop West Jordan, UT 84084
Estimated Value: $451,000 - $482,373
2
Beds
1
Bath
923
Sq Ft
$501/Sq Ft
Est. Value
About This Home
This home is located at 2858 Strawberry Loop, West Jordan, UT 84084 and is currently estimated at $462,093, approximately $500 per square foot. 2858 Strawberry Loop is a home located in Salt Lake County with nearby schools including Westland Elementary School, Joel P. Jensen Middle School, and West Jordan High School.
Ownership History
Date
Name
Owned For
Owner Type
Purchase Details
Closed on
Aug 15, 2025
Sold by
Perry Elaine
Bought by
Elaine Perry Revocable Living Trust and Perry
Current Estimated Value
Purchase Details
Closed on
Jun 22, 2016
Sold by
Perry Michael G
Bought by
Perry Elaine
Purchase Details
Closed on
Mar 16, 2001
Sold by
Perry Michael G
Bought by
Perry Michael G and Perry Elaine
Home Financials for this Owner
Home Financials are based on the most recent Mortgage that was taken out on this home.
Original Mortgage
$114,000
Interest Rate
6.97%
Purchase Details
Closed on
Jul 25, 1997
Sold by
Perry Michael G and Boswell Elaine D
Bought by
Perry Michael G
Home Financials for this Owner
Home Financials are based on the most recent Mortgage that was taken out on this home.
Original Mortgage
$98,000
Interest Rate
7.7%
Create a Home Valuation Report for This Property
The Home Valuation Report is an in-depth analysis detailing your home's value as well as a comparison with similar homes in the area
Home Values in the Area
Average Home Value in this Area
Purchase History
| Date | Buyer | Sale Price | Title Company |
|---|---|---|---|
| Elaine Perry Revocable Living Trust | -- | None Listed On Document | |
| Perry Elaine | -- | Us Title | |
| Perry Michael G | -- | United Title Services | |
| Perry Michael G | -- | -- |
Source: Public Records
Mortgage History
| Date | Status | Borrower | Loan Amount |
|---|---|---|---|
| Previous Owner | Perry Michael G | $114,000 | |
| Previous Owner | Perry Michael G | $98,000 |
Source: Public Records
Tax History Compared to Growth
Tax History
| Year | Tax Paid | Tax Assessment Tax Assessment Total Assessment is a certain percentage of the fair market value that is determined by local assessors to be the total taxable value of land and additions on the property. | Land | Improvement |
|---|---|---|---|---|
| 2025 | $2,215 | $441,500 | $131,200 | $310,300 |
| 2024 | $2,215 | $426,100 | $126,800 | $299,300 |
| 2023 | $2,009 | $364,300 | $119,700 | $244,600 |
| 2022 | $2,081 | $371,300 | $117,400 | $253,900 |
| 2021 | $1,783 | $289,500 | $88,000 | $201,500 |
| 2020 | $1,654 | $252,000 | $88,000 | $164,000 |
| 2019 | $1,657 | $247,700 | $88,000 | $159,700 |
| 2018 | $1,571 | $232,800 | $84,900 | $147,900 |
| 2017 | $1,471 | $217,100 | $84,900 | $132,200 |
| 2016 | $1,384 | $191,900 | $84,900 | $107,000 |
| 2015 | $1,397 | $188,900 | $86,500 | $102,400 |
| 2014 | $1,340 | $178,400 | $82,500 | $95,900 |
Source: Public Records
Map
Nearby Homes
- 7721 Sunset Cir
- 2886 W 7550 S
- 7642 S 2700 W
- 7942 S 2800 W
- 3066 W Linton Dr
- 3165 W 7720 S
- 7604 S Autumn Dr
- 7987 S 2980 W
- 7993 S 2760 W
- 7968 S 2700 W
- 7647 S 2500 W
- 2573 Jordan Meadows Ln
- 3354 W 7800 S
- 7611 S Springbrook Dr
- 2386 W 7680 S
- 7361 S 2700 W
- 2510 W Jordan Meadows Ln
- 3422 Briar Dr
- 2497 Bueno Vista Dr
- 3332 Lower Newark Way
- 7725 Strawberry Loop
- 7725 S Strawberry Loop
- 7121 W 7740 S Unit 233
- 7722 S Strawberry Dr
- 7722 Strawberry Dr
- 2857 Strawberry Loop
- 7753 S Strawberry Loop
- 7730 Strawberry Loop
- 7742 Strawberry Loop
- 7742 S Strawberry Loop
- 2839 W Strawberry Loop
- 2842 W Strawberry Loop
- 2839 W Strawberry Loop
- 2839 W Strawberry Loop
- 7713 Strawberry Loop
- 7718 Strawberry Loop
- 7710 Strawberry Dr
- 7754 Strawberry Loop
- 7767 Strawberry Loop
- 7706 Strawberry Loop