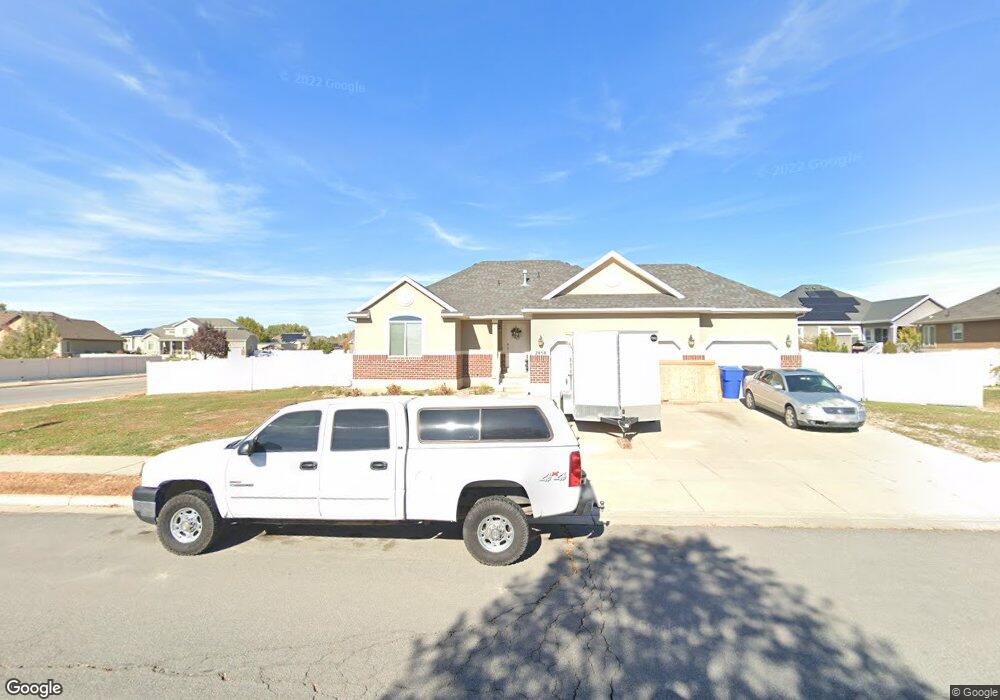
2858 W 100 S West Point, UT 84015
Estimated Value: $570,000 - $667,000
6
Beds
3
Baths
2,689
Sq Ft
$228/Sq Ft
Est. Value
About This Home
This home is located at 2858 W 100 S, West Point, UT 84015 and is currently estimated at $611,962, approximately $227 per square foot. 2858 W 100 S is a home located in Davis County with nearby schools including West Point School, West Point Junior High School, and Syracuse High School.
Ownership History
Date
Name
Owned For
Owner Type
Purchase Details
Closed on
Aug 1, 2019
Sold by
Cooper Julie
Bought by
Kotter Joseph
Current Estimated Value
Home Financials for this Owner
Home Financials are based on the most recent Mortgage that was taken out on this home.
Original Mortgage
$362,484
Outstanding Balance
$315,444
Interest Rate
3.5%
Mortgage Type
FHA
Estimated Equity
$296,518
Purchase Details
Closed on
Oct 30, 2017
Sold by
Cooper Toby Lynn and Cooper Julie
Bought by
Cooper Julie
Purchase Details
Closed on
Apr 13, 2011
Sold by
Ivory Homes Ltd
Bought by
Cooper Toby Lynn and Cooper Julie
Home Financials for this Owner
Home Financials are based on the most recent Mortgage that was taken out on this home.
Original Mortgage
$261,349
Interest Rate
4.83%
Mortgage Type
VA
Create a Home Valuation Report for This Property
The Home Valuation Report is an in-depth analysis detailing your home's value as well as a comparison with similar homes in the area
Home Values in the Area
Average Home Value in this Area
Purchase History
| Date | Buyer | Sale Price | Title Company |
|---|---|---|---|
| Kotter Joseph | -- | Us Title Company | |
| Cooper Julie | -- | -- | |
| Cooper Toby Lynn | -- | Cottonwood Title In | |
| Ivory Homes Ltd | -- | Cottonwood Title In |
Source: Public Records
Mortgage History
| Date | Status | Borrower | Loan Amount |
|---|---|---|---|
| Open | Kotter Joseph | $362,484 | |
| Previous Owner | Cooper Toby Lynn | $261,349 |
Source: Public Records
Tax History Compared to Growth
Tax History
| Year | Tax Paid | Tax Assessment Tax Assessment Total Assessment is a certain percentage of the fair market value that is determined by local assessors to be the total taxable value of land and additions on the property. | Land | Improvement |
|---|---|---|---|---|
| 2025 | $2,952 | $276,650 | $109,684 | $166,966 |
| 2024 | $3,190 | $300,300 | $98,735 | $201,565 |
| 2023 | $2,986 | $517,000 | $123,821 | $393,179 |
| 2022 | $3,116 | $295,350 | $64,617 | $230,733 |
| 2021 | $2,772 | $393,000 | $100,151 | $292,849 |
| 2020 | $2,444 | $342,000 | $84,283 | $257,717 |
| 2019 | $2,341 | $323,000 | $81,727 | $241,273 |
| 2018 | $2,324 | $316,000 | $81,405 | $234,595 |
| 2016 | $2,264 | $162,030 | $31,512 | $130,518 |
| 2015 | $2,385 | $161,700 | $31,512 | $130,188 |
| 2014 | $1,916 | $131,760 | $31,512 | $100,248 |
| 2013 | -- | $109,307 | $37,728 | $71,579 |
Source: Public Records
Map
Nearby Homes
- 2792 W 50 S
- 164 S 2875 W
- 1159 S 4350 W
- 2633 N 2080 W Unit 180
- 2623 N 2080 W Unit 178
- 380 S 4300 W Unit 608
- 997 N 5100 W Unit 213
- 2619 N 2080 W Unit 177
- 2627 N 2080 W Unit 179
- 3232 W 375 N Unit 7
- 3258 W 375 N Unit 9
- 260 W Antelope Dr S
- 4200 W 800 N
- 488 N 3100 W
- 3187 W 525 N
- 2535 W 550 N
- 399 N 3425 W
- 3212 W 600 N
- 2283 W 470 N
- 27 S 3830 W Unit 437