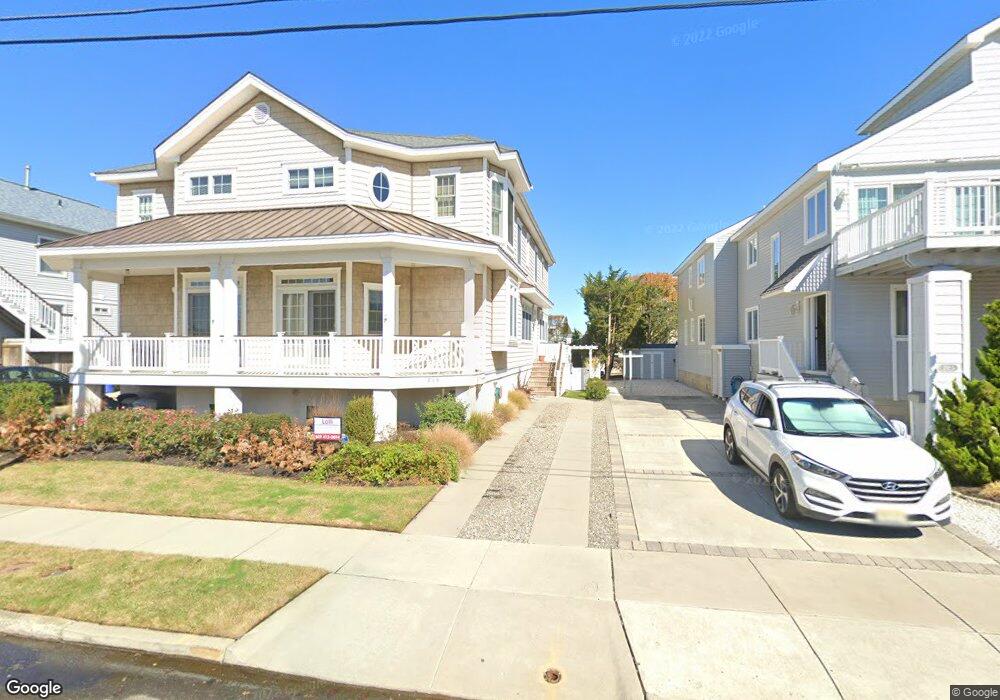
286 92nd St Stone Harbor, NJ 08247
Estimated Value: $2,786,937 - $3,998,000
--
Bed
--
Bath
2,222
Sq Ft
$1,474/Sq Ft
Est. Value
About This Home
This home is located at 286 92nd St, Stone Harbor, NJ 08247 and is currently estimated at $3,274,984, approximately $1,473 per square foot. 286 92nd St is a home located in Cape May County with nearby schools including Stone Harbor Elementary School.
Ownership History
Date
Name
Owned For
Owner Type
Purchase Details
Closed on
Mar 18, 2004
Sold by
Climans Gary Lee Mc
Bought by
Cannon John and Cannon Patricia
Current Estimated Value
Home Financials for this Owner
Home Financials are based on the most recent Mortgage that was taken out on this home.
Original Mortgage
$388,000
Interest Rate
4.12%
Mortgage Type
Purchase Money Mortgage
Purchase Details
Closed on
Aug 29, 1988
Sold by
Parker Betty Decd and Shoop Jr,A Exc
Bought by
Shoop Arthur and Shoop Lillian
Create a Home Valuation Report for This Property
The Home Valuation Report is an in-depth analysis detailing your home's value as well as a comparison with similar homes in the area
Home Values in the Area
Average Home Value in this Area
Purchase History
| Date | Buyer | Sale Price | Title Company |
|---|---|---|---|
| Cannon John | $485,000 | -- | |
| Cannon John | $485,000 | Seaboard Title Agency | |
| Shoop Arthur | -- | -- |
Source: Public Records
Mortgage History
| Date | Status | Borrower | Loan Amount |
|---|---|---|---|
| Previous Owner | Cannon John | $388,000 | |
| Closed | Cannon John | $48,500 |
Source: Public Records
Tax History Compared to Growth
Tax History
| Year | Tax Paid | Tax Assessment Tax Assessment Total Assessment is a certain percentage of the fair market value that is determined by local assessors to be the total taxable value of land and additions on the property. | Land | Improvement |
|---|---|---|---|---|
| 2025 | $8,222 | $1,099,200 | $624,000 | $475,200 |
| 2024 | $8,222 | $1,099,200 | $624,000 | $475,200 |
| 2023 | $8,079 | $1,099,200 | $624,000 | $475,200 |
| 2022 | $7,606 | $1,099,200 | $624,000 | $475,200 |
| 2021 | $7,211 | $1,099,200 | $624,000 | $475,200 |
| 2020 | $6,705 | $1,099,200 | $624,000 | $475,200 |
| 2019 | $6,298 | $1,099,200 | $624,000 | $475,200 |
| 2018 | $6,068 | $1,099,200 | $624,000 | $475,200 |
| 2017 | $4,569 | $823,200 | $499,200 | $324,000 |
| 2016 | $4,404 | $823,200 | $499,200 | $324,000 |
| 2015 | $4,322 | $823,200 | $499,200 | $324,000 |
| 2014 | $4,264 | $823,200 | $499,200 | $324,000 |
Source: Public Records
Map
Nearby Homes