286 Breen St Marion, OH 43302
Estimated Value: $54,000 - $136,000
3
Beds
2
Baths
1,096
Sq Ft
$73/Sq Ft
Est. Value
About This Home
This home is located at 286 Breen St, Marion, OH 43302 and is currently estimated at $79,492, approximately $72 per square foot. 286 Breen St is a home located in Marion County with nearby schools including Rutherford B. Hayes Elementary School, Ulysses S. Grant Middle School, and Harding High School.
Ownership History
Date
Name
Owned For
Owner Type
Purchase Details
Closed on
Jan 22, 2024
Sold by
Williams Michael James and Kathicita Elsie
Bought by
Castillo Helder
Current Estimated Value
Purchase Details
Closed on
Jul 7, 2020
Sold by
Wells Fargo Bank Na
Bought by
Yubi Kathicita Elsie and Scoit Robert Eugene
Purchase Details
Closed on
Mar 25, 2020
Sold by
Wickham Austin and Estate Of James Wickham
Bought by
Wells Fargo Bank Na
Purchase Details
Closed on
Jul 2, 2008
Sold by
Rife Troy and Rife Mindy
Bought by
Wickham James L
Home Financials for this Owner
Home Financials are based on the most recent Mortgage that was taken out on this home.
Original Mortgage
$50,242
Interest Rate
6.5%
Mortgage Type
Future Advance Clause Open End Mortgage
Purchase Details
Closed on
Jun 11, 1999
Bought by
Wickham James L
Purchase Details
Closed on
Aug 3, 1993
Bought by
Wickham James L
Create a Home Valuation Report for This Property
The Home Valuation Report is an in-depth analysis detailing your home's value as well as a comparison with similar homes in the area
Home Values in the Area
Average Home Value in this Area
Purchase History
| Date | Buyer | Sale Price | Title Company |
|---|---|---|---|
| Castillo Helder | $37,000 | None Listed On Document | |
| Castillo Helder | $37,000 | None Listed On Document | |
| Yubi Kathicita Elsie | $15,000 | None Available | |
| Wells Fargo Bank Na | $16,000 | None Available | |
| Wickham James L | $55,000 | Versa Title/Associated Feder | |
| Wickham James L | $22,000 | -- | |
| Wickham James L | $16,000 | -- |
Source: Public Records
Mortgage History
| Date | Status | Borrower | Loan Amount |
|---|---|---|---|
| Previous Owner | Wickham James L | $50,242 |
Source: Public Records
Tax History
| Year | Tax Paid | Tax Assessment Tax Assessment Total Assessment is a certain percentage of the fair market value that is determined by local assessors to be the total taxable value of land and additions on the property. | Land | Improvement |
|---|---|---|---|---|
| 2025 | $586 | $18,550 | $2,060 | $16,490 |
| 2024 | $586 | $15,250 | $2,000 | $13,250 |
| 2023 | $586 | $15,250 | $2,000 | $13,250 |
| 2022 | $544 | $15,250 | $2,000 | $13,250 |
| 2021 | $594 | $14,990 | $1,740 | $13,250 |
| 2020 | $619 | $15,580 | $1,740 | $13,840 |
| 2019 | $1,361 | $16,170 | $1,740 | $14,430 |
| 2018 | $1,378 | $17,480 | $1,750 | $15,730 |
| 2017 | $920 | $17,480 | $1,750 | $15,730 |
| 2016 | $340 | $17,480 | $1,750 | $15,730 |
| 2015 | $333 | $17,120 | $1,660 | $15,460 |
| 2014 | $980 | $17,120 | $1,660 | $15,460 |
| 2012 | $317 | $16,680 | $2,080 | $14,600 |
Source: Public Records
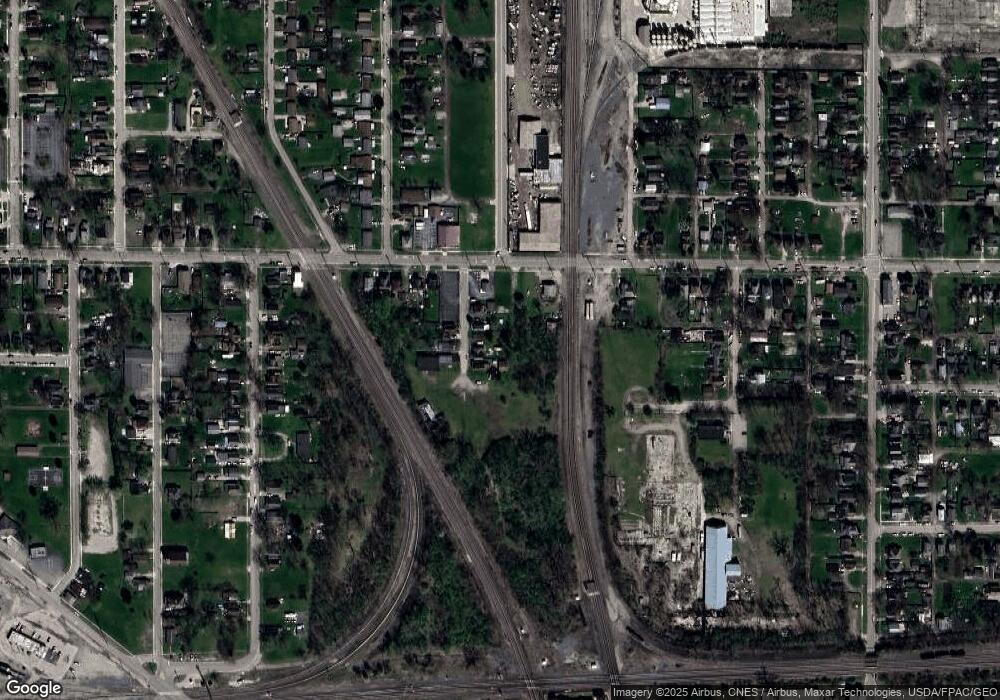
Map
Nearby Homes
Your Personal Tour Guide
Ask me questions while you tour the home.