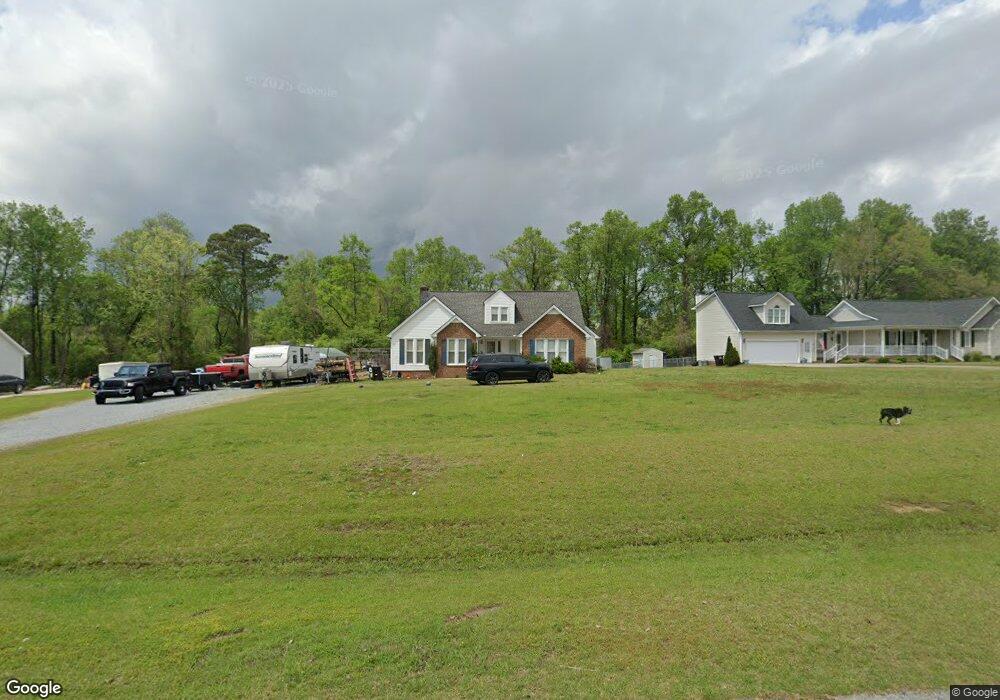
286 Clearfield Dr Angier, NC 27501
Estimated Value: $233,000 - $352,000
3
Beds
3
Baths
1,962
Sq Ft
$156/Sq Ft
Est. Value
About This Home
This home is located at 286 Clearfield Dr, Angier, NC 27501 and is currently estimated at $305,233, approximately $155 per square foot. 286 Clearfield Dr is a home located in Harnett County with nearby schools including Angier Elementary School, North Harnett Primary School, and Harnett Central Middle School.
Ownership History
Date
Name
Owned For
Owner Type
Purchase Details
Closed on
Nov 24, 2014
Sold by
Syphrit Carro Holbrook and Syphrit Jason D
Bought by
Syphrit Carro Holbrook and Syphrit Jason D
Current Estimated Value
Home Financials for this Owner
Home Financials are based on the most recent Mortgage that was taken out on this home.
Original Mortgage
$144,000
Outstanding Balance
$109,282
Interest Rate
3.75%
Mortgage Type
Adjustable Rate Mortgage/ARM
Estimated Equity
$195,951
Purchase Details
Closed on
Sep 17, 2013
Sold by
First Troy Spe Llc
Bought by
Syphrit Carro Holbrook
Home Financials for this Owner
Home Financials are based on the most recent Mortgage that was taken out on this home.
Original Mortgage
$86,385
Interest Rate
4.87%
Mortgage Type
FHA
Purchase Details
Closed on
Jul 23, 2013
Sold by
Carter Jill B
Bought by
First Troy Spe Llc
Home Financials for this Owner
Home Financials are based on the most recent Mortgage that was taken out on this home.
Original Mortgage
$86,385
Interest Rate
4.87%
Mortgage Type
FHA
Create a Home Valuation Report for This Property
The Home Valuation Report is an in-depth analysis detailing your home's value as well as a comparison with similar homes in the area
Home Values in the Area
Average Home Value in this Area
Purchase History
| Date | Buyer | Sale Price | Title Company |
|---|---|---|---|
| Syphrit Carro Holbrook | -- | None Available | |
| Syphrit Carro Holbrook | $88,000 | None Available | |
| First Troy Spe Llc | $87,750 | None Available |
Source: Public Records
Mortgage History
| Date | Status | Borrower | Loan Amount |
|---|---|---|---|
| Open | Syphrit Carro Holbrook | $144,000 | |
| Closed | Syphrit Carro Holbrook | $86,385 |
Source: Public Records
Tax History
| Year | Tax Paid | Tax Assessment Tax Assessment Total Assessment is a certain percentage of the fair market value that is determined by local assessors to be the total taxable value of land and additions on the property. | Land | Improvement |
|---|---|---|---|---|
| 2025 | $2,683 | $222,819 | $0 | $0 |
| 2024 | $2,683 | $222,819 | $0 | $0 |
| 2023 | $2,661 | $222,819 | $0 | $0 |
| 2022 | $2,661 | $222,819 | $0 | $0 |
| 2021 | $1,551 | $108,620 | $0 | $0 |
| 2020 | $1,551 | $108,620 | $0 | $0 |
| 2019 | $1,536 | $108,620 | $0 | $0 |
| 2018 | $1,536 | $108,620 | $0 | $0 |
| 2017 | $1,536 | $108,620 | $0 | $0 |
| 2016 | $1,807 | $128,660 | $0 | $0 |
| 2015 | $1,807 | $128,660 | $0 | $0 |
| 2014 | $1,807 | $128,660 | $0 | $0 |
Source: Public Records
Map
Nearby Homes
- 68 Willow Cameron Way
- 98 Willow Cameron Way
- 69 Willow Cameron Way
- 79 Willow Cameron Way
- 89 Willow Cameron Way
- 116 Willow Cameron Way
- Wynwood Plan at Station Pointe
- Middleton Plan at Station Pointe
- Millhaven Plan at Station Pointe
- Merlot Plan at Station Pointe
- Malbec Plan at Station Pointe
- Burton Plan at Station Pointe
- Jordan Plan at Station Pointe
- Pelham Plan at Station Pointe
- Cooper 3 Plan at Station Pointe
- Drayton Plan at Station Pointe
- Elmhurst Plan at Station Pointe
- Bordeaux Plan at Station Pointe
- Wagener Plan at Station Pointe
- Callaway Plan at Station Pointe
- 254 Clearfield Dr
- 310 Clearfield Dr
- 301 Clearfield Dr
- 234 Clearfield Dr
- 291 Clearfield Dr
- 11 Fairfield Ct
- 139 Fairfield Ct
- 103 Fairfield Ct
- 317 Clearfield Dr
- 218 Clearfield Dr
- 318 Clearfield Dr
- 200 Clearfield Dr
- 40 Fairfield Ct
- 197 Clearfield Dr
- 35 Fairfield Ct
- 198 Clearfield Dr
- 42 Fairfield Ct
- 161 Clearfield Dr
- 172 Clearfield Dr
- 78 Fox Field Ct
Your Personal Tour Guide
Ask me questions while you tour the home.