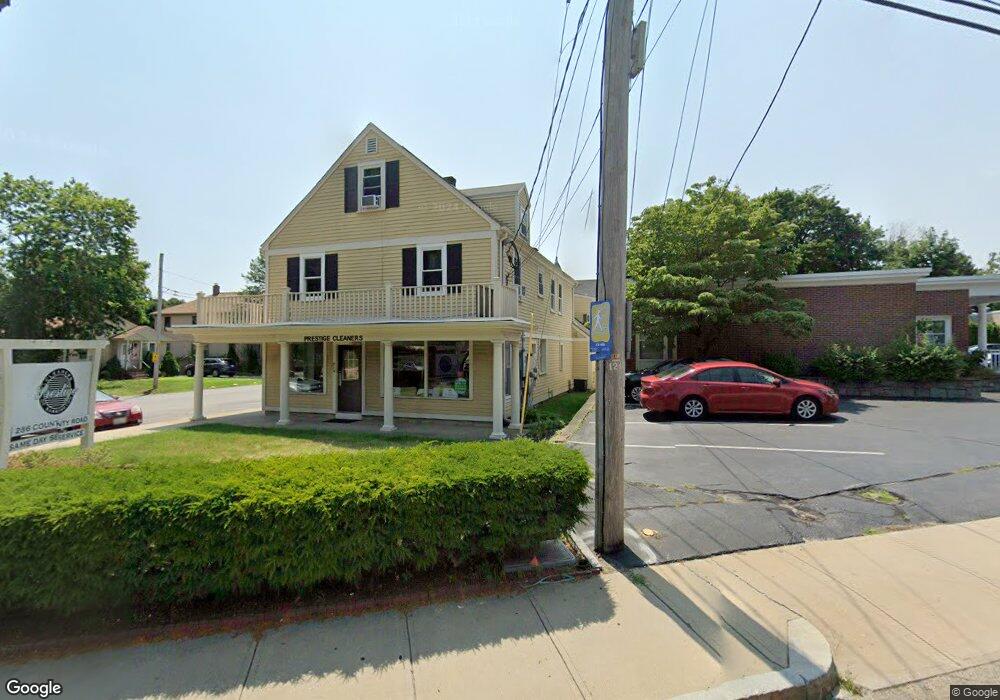
286 County Rd Barrington, RI 02806
North Barrington NeighborhoodEstimated Value: $1,561,156
2
Beds
1
Bath
5,165
Sq Ft
$302/Sq Ft
Est. Value
About This Home
This home is located at 286 County Rd, Barrington, RI 02806 and is currently estimated at $1,561,156, approximately $302 per square foot. 286 County Rd is a home located in Bristol County with nearby schools including Barrington High School, Barrington Christian Academy, and St. Andrews School.
Ownership History
Date
Name
Owned For
Owner Type
Purchase Details
Closed on
May 3, 2012
Sold by
Ryan Family Lp
Bought by
Jgm Realty Assoc Llc
Current Estimated Value
Home Financials for this Owner
Home Financials are based on the most recent Mortgage that was taken out on this home.
Original Mortgage
$387,500
Interest Rate
4.08%
Mortgage Type
Commercial
Create a Home Valuation Report for This Property
The Home Valuation Report is an in-depth analysis detailing your home's value as well as a comparison with similar homes in the area
Home Values in the Area
Average Home Value in this Area
Purchase History
| Date | Buyer | Sale Price | Title Company |
|---|---|---|---|
| Jgm Realty Assoc Llc | $650,000 | -- |
Source: Public Records
Mortgage History
| Date | Status | Borrower | Loan Amount |
|---|---|---|---|
| Open | Jgm Realty Assoc Llc | $322,000 | |
| Closed | Jgm Realty Assoc Llc | $387,500 |
Source: Public Records
Tax History
| Year | Tax Paid | Tax Assessment Tax Assessment Total Assessment is a certain percentage of the fair market value that is determined by local assessors to be the total taxable value of land and additions on the property. | Land | Improvement |
|---|---|---|---|---|
| 2025 | $15,954 | $1,040,000 | $539,000 | $501,000 |
| 2024 | $15,340 | $1,040,000 | $539,000 | $501,000 |
| 2023 | $16,707 | $823,000 | $312,000 | $511,000 |
| 2022 | $16,172 | $823,000 | $312,000 | $511,000 |
| 2021 | $15,703 | $820,000 | $312,000 | $508,000 |
| 2020 | $15,090 | $722,000 | $271,000 | $451,000 |
| 2019 | $14,512 | $722,000 | $271,000 | $451,000 |
| 2018 | $14,079 | $722,000 | $271,000 | $451,000 |
| 2017 | $12,154 | $607,700 | $180,700 | $427,000 |
| 2016 | $11,212 | $607,700 | $180,700 | $427,000 |
| 2015 | $11,091 | $607,700 | $180,700 | $427,000 |
| 2014 | $9,814 | $536,300 | $180,700 | $355,600 |
Source: Public Records
Map
Nearby Homes
Your Personal Tour Guide
Ask me questions while you tour the home.