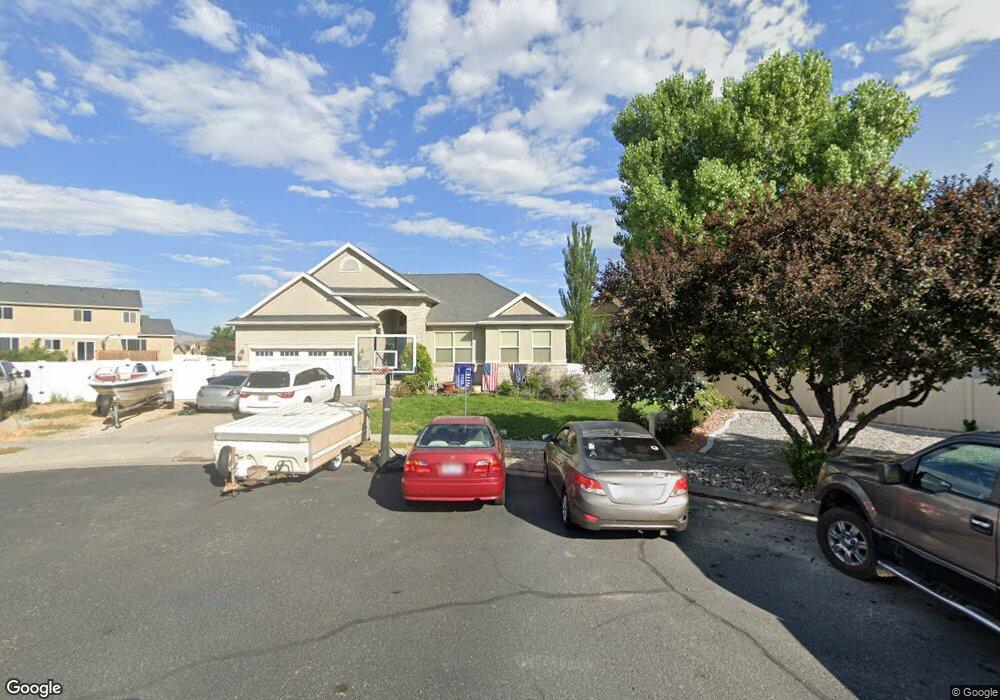
286 Cove Cir Tooele, UT 84074
Estimated Value: $510,000 - $547,000
3
Beds
3
Baths
3,224
Sq Ft
$166/Sq Ft
Est. Value
About This Home
This home is located at 286 Cove Cir, Tooele, UT 84074 and is currently estimated at $535,081, approximately $165 per square foot. 286 Cove Cir is a home located in Tooele County with nearby schools including Stansbury Park Elementary School, Clarke N. Johnsen Junior High School, and Stansbury High School.
Ownership History
Date
Name
Owned For
Owner Type
Purchase Details
Closed on
Dec 8, 2016
Bought by
Sharp Jeremy
Current Estimated Value
Home Financials for this Owner
Home Financials are based on the most recent Mortgage that was taken out on this home.
Original Mortgage
$265,656
Outstanding Balance
$218,453
Interest Rate
4.13%
Estimated Equity
$316,628
Purchase Details
Closed on
Apr 25, 2008
Sold by
Mcconnell James
Bought by
Mcconnell James
Home Financials for this Owner
Home Financials are based on the most recent Mortgage that was taken out on this home.
Original Mortgage
$173,000
Interest Rate
6.11%
Mortgage Type
New Conventional
Purchase Details
Closed on
Mar 29, 2006
Sold by
Richmond American Homes Of Utah Inc
Bought by
Mcconnell James
Home Financials for this Owner
Home Financials are based on the most recent Mortgage that was taken out on this home.
Original Mortgage
$184,737
Interest Rate
6.25%
Mortgage Type
New Conventional
Create a Home Valuation Report for This Property
The Home Valuation Report is an in-depth analysis detailing your home's value as well as a comparison with similar homes in the area
Home Values in the Area
Average Home Value in this Area
Purchase History
| Date | Buyer | Sale Price | Title Company |
|---|---|---|---|
| Sharp Jeremy | -- | -- | |
| Mcconnell James | -- | Legacy Land Title Co | |
| Mcconnell James | -- | First American Title Ins Age |
Source: Public Records
Mortgage History
| Date | Status | Borrower | Loan Amount |
|---|---|---|---|
| Open | Sharp Jeremy | $265,656 | |
| Closed | Sharp Jeremy | -- | |
| Previous Owner | Mcconnell James | $173,000 | |
| Previous Owner | Mcconnell James | $184,737 |
Source: Public Records
Tax History Compared to Growth
Tax History
| Year | Tax Paid | Tax Assessment Tax Assessment Total Assessment is a certain percentage of the fair market value that is determined by local assessors to be the total taxable value of land and additions on the property. | Land | Improvement |
|---|---|---|---|---|
| 2025 | $3,690 | $466,413 | $164,000 | $302,413 |
| 2024 | $4,199 | $269,762 | $90,200 | $179,562 |
| 2023 | $4,199 | $253,468 | $86,350 | $167,118 |
| 2022 | $3,261 | $261,708 | $85,470 | $176,238 |
| 2021 | $2,710 | $179,640 | $63,470 | $116,170 |
| 2020 | $2,618 | $303,413 | $92,000 | $211,413 |
| 2019 | $2,554 | $291,111 | $92,000 | $199,111 |
| 2018 | $2,350 | $256,634 | $47,500 | $209,134 |
| 2017 | $2,135 | $246,675 | $47,500 | $199,175 |
| 2016 | $1,848 | $121,383 | $26,125 | $95,258 |
| 2015 | $1,848 | $115,991 | $0 | $0 |
| 2014 | -- | $115,991 | $0 | $0 |
Source: Public Records
Map
Nearby Homes
- 395 W Broome St
- 138 W Morning Glory Cir
- 5675 Lanyard Ln
- 5718 Lanyard Ln
- 137 Stern Ct
- 485 Delancey St
- 122 Stern Ct
- 5531 Ponderosa Ln
- 133 W Marigold Cir Unit 311
- 5584 N Gentle Breeze Ct
- 5784 Manhattan Dr
- 5943 N Bleeker St
- 5975 Yachtsman Ln
- 5668 Ibis Rd
- 5668 N Ibis Rd
- 5644 Ibis Rd
- 5644 N Ibis Rd
- 590 W Junegrass Ln
- 598 W Junegrass Ln
- 595 W Junegrass Ln