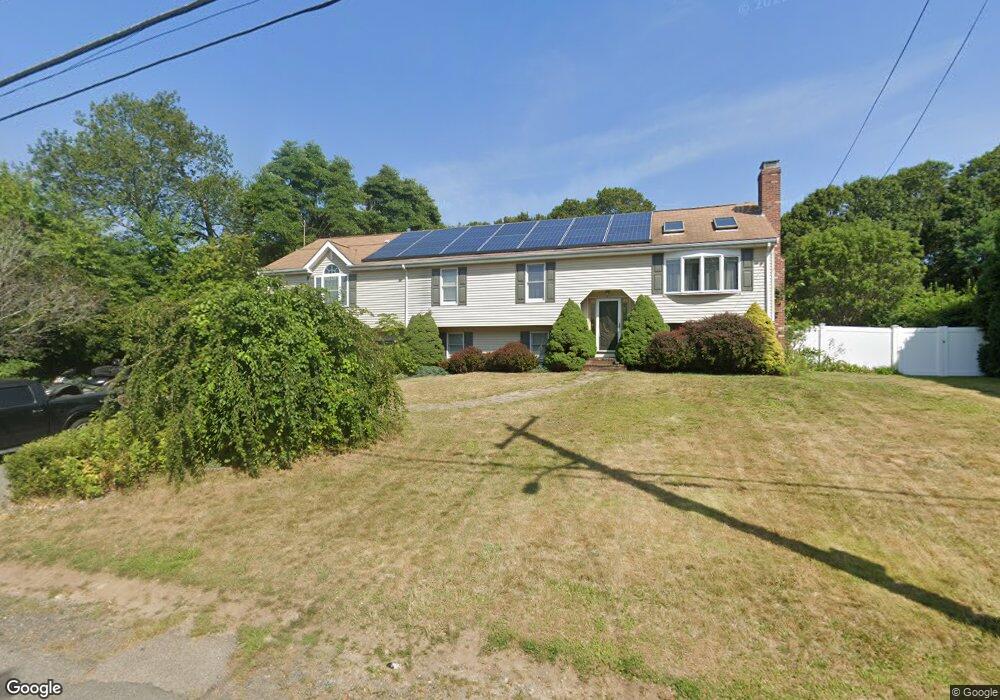
286 Field St Brockton, MA 02302
Montello NeighborhoodEstimated Value: $672,401 - $726,000
5
Beds
3
Baths
1,852
Sq Ft
$380/Sq Ft
Est. Value
About This Home
This home is located at 286 Field St, Brockton, MA 02302 and is currently estimated at $704,600, approximately $380 per square foot. 286 Field St is a home located in Plymouth County with nearby schools including Brookfield Elementary School, Mary E. Baker Elementary School, and Downey Elementary School.
Ownership History
Date
Name
Owned For
Owner Type
Purchase Details
Closed on
Aug 3, 2016
Sold by
Truehart Jason K
Bought by
Truehart Jason K
Current Estimated Value
Purchase Details
Closed on
Jan 22, 2010
Sold by
Truehart Jason K and Conti Janine E
Bought by
Truehart Jason K
Home Financials for this Owner
Home Financials are based on the most recent Mortgage that was taken out on this home.
Original Mortgage
$311,100
Interest Rate
4.5%
Mortgage Type
FHA
Purchase Details
Closed on
Sep 22, 1998
Sold by
Sharland Nancy M
Bought by
Truehart Jason K and Conti Janine E
Create a Home Valuation Report for This Property
The Home Valuation Report is an in-depth analysis detailing your home's value as well as a comparison with similar homes in the area
Home Values in the Area
Average Home Value in this Area
Purchase History
| Date | Buyer | Sale Price | Title Company |
|---|---|---|---|
| Truehart Jason K | -- | -- | |
| Truehart Jason K | -- | -- | |
| Truehart Jason K | $136,150 | -- |
Source: Public Records
Mortgage History
| Date | Status | Borrower | Loan Amount |
|---|---|---|---|
| Previous Owner | Truehart Jason K | $311,100 | |
| Previous Owner | Truehart Jason K | $75,000 | |
| Previous Owner | Truehart Jason K | $236,600 | |
| Previous Owner | Truehart Jason K | $180,000 |
Source: Public Records
Tax History
| Year | Tax Paid | Tax Assessment Tax Assessment Total Assessment is a certain percentage of the fair market value that is determined by local assessors to be the total taxable value of land and additions on the property. | Land | Improvement |
|---|---|---|---|---|
| 2025 | $7,709 | $636,600 | $174,100 | $462,500 |
| 2024 | $7,380 | $614,000 | $174,100 | $439,900 |
| 2023 | $6,766 | $521,300 | $126,300 | $395,000 |
| 2022 | $6,598 | $472,300 | $114,800 | $357,500 |
| 2021 | $6,461 | $445,600 | $103,600 | $342,000 |
| 2020 | $6,031 | $398,100 | $90,300 | $307,800 |
| 2019 | $6,202 | $399,100 | $86,500 | $312,600 |
| 2018 | $5,701 | $355,000 | $86,500 | $268,500 |
| 2017 | $5,287 | $328,400 | $86,500 | $241,900 |
| 2016 | $5,656 | $325,800 | $82,800 | $243,000 |
| 2015 | $5,411 | $298,100 | $82,800 | $215,300 |
| 2014 | $5,368 | $296,100 | $82,800 | $213,300 |
Source: Public Records
Map
Nearby Homes
Your Personal Tour Guide
Ask me questions while you tour the home.