Estimated Value: $112,000 - $164,522
4
Beds
2
Baths
1,440
Sq Ft
$103/Sq Ft
Est. Value
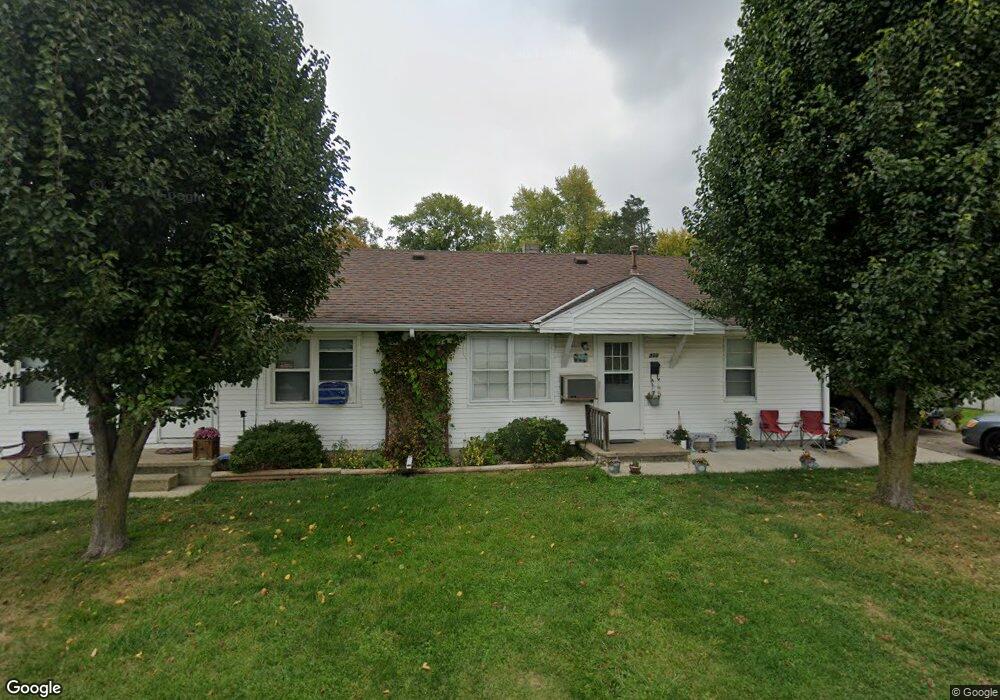
About This Home
This home is located at 286 High St Unit 292, Xenia, OH 45385 and is currently estimated at $148,381, approximately $103 per square foot. 286 High St Unit 292 is a home located in Greene County with nearby schools including Xenia High School, Summit Academy Community School for Alternative Learners - Xenia, and Legacy Christian Academy.
Ownership History
Date
Name
Owned For
Owner Type
Purchase Details
Closed on
Aug 30, 2016
Sold by
Long Carol J
Bought by
Taylor Gary
Current Estimated Value
Purchase Details
Closed on
Sep 3, 1998
Sold by
Long Robert L
Bought by
Long Carol J
Home Financials for this Owner
Home Financials are based on the most recent Mortgage that was taken out on this home.
Original Mortgage
$29,860
Outstanding Balance
$6,456
Interest Rate
7.04%
Mortgage Type
Seller Take Back
Estimated Equity
$141,925
Purchase Details
Closed on
Oct 1, 1986
Bought by
Long Carol J
Create a Home Valuation Report for This Property
The Home Valuation Report is an in-depth analysis detailing your home's value as well as a comparison with similar homes in the area
Home Values in the Area
Average Home Value in this Area
Purchase History
| Date | Buyer | Sale Price | Title Company |
|---|---|---|---|
| Taylor Gary | $45,000 | Attorney | |
| Long Carol J | -- | -- | |
| Long Carol J | $31,000 | -- |
Source: Public Records
Mortgage History
| Date | Status | Borrower | Loan Amount |
|---|---|---|---|
| Open | Long Carol J | $29,860 |
Source: Public Records
Tax History Compared to Growth
Tax History
| Year | Tax Paid | Tax Assessment Tax Assessment Total Assessment is a certain percentage of the fair market value that is determined by local assessors to be the total taxable value of land and additions on the property. | Land | Improvement |
|---|---|---|---|---|
| 2024 | $1,333 | $31,160 | $4,870 | $26,290 |
| 2023 | $1,333 | $31,160 | $4,870 | $26,290 |
| 2022 | $1,181 | $23,550 | $3,900 | $19,650 |
| 2021 | $1,197 | $23,550 | $3,900 | $19,650 |
| 2020 | $1,147 | $23,550 | $3,900 | $19,650 |
| 2019 | $929 | $17,960 | $4,330 | $13,630 |
| 2018 | $933 | $17,960 | $4,330 | $13,630 |
| 2017 | $481 | $17,960 | $4,330 | $13,630 |
| 2016 | $481 | $18,090 | $4,330 | $13,760 |
| 2015 | $483 | $18,090 | $4,330 | $13,760 |
| 2014 | $462 | $18,090 | $4,330 | $13,760 |
Source: Public Records
Map
Nearby Homes