286 Lorenz Rd San Antonio, TX 78209
Oak Park-Northwood NeighborhoodEstimated Value: $426,000 - $523,000
3
Beds
2
Baths
1,597
Sq Ft
$304/Sq Ft
Est. Value
About This Home
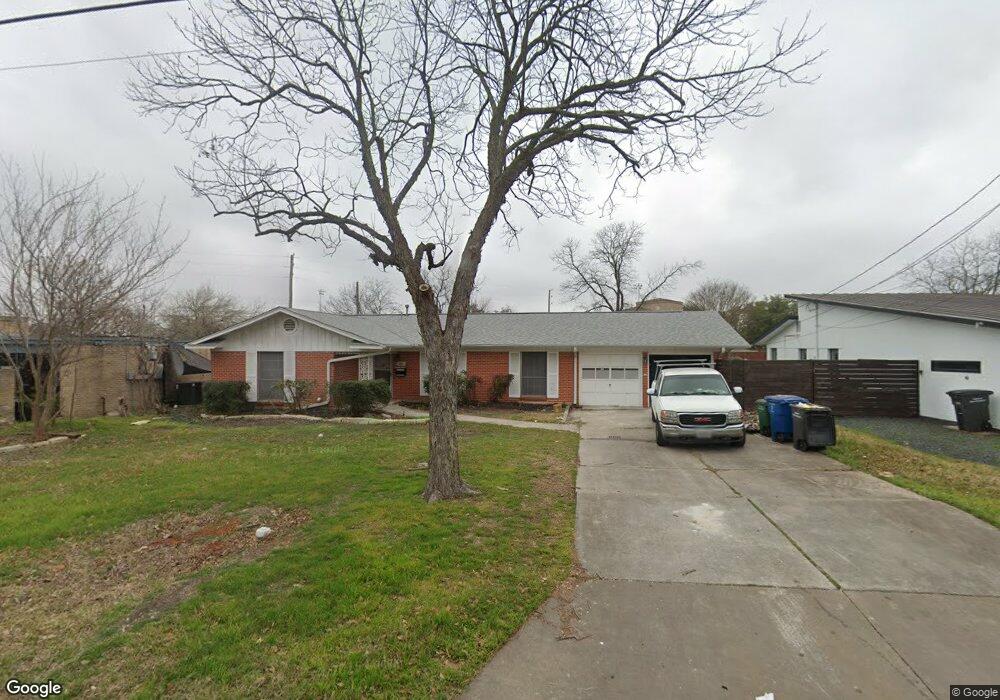
This home is located at 286 Lorenz Rd, San Antonio, TX 78209 and is currently estimated at $484,790, approximately $303 per square foot. 286 Lorenz Rd is a home located in Bexar County with nearby schools including Woodridge Elementary School, Alamo Heights Junior School, and Alamo Heights High School.
Ownership History
Date
Name
Owned For
Owner Type
Purchase Details
Closed on
Oct 31, 2024
Sold by
Murphy Home Buyers Llc
Bought by
Sparklez Realty V Llc
Current Estimated Value
Home Financials for this Owner
Home Financials are based on the most recent Mortgage that was taken out on this home.
Original Mortgage
$200,000
Outstanding Balance
$197,687
Interest Rate
6.32%
Mortgage Type
New Conventional
Estimated Equity
$287,103
Purchase Details
Closed on
Jul 28, 2023
Sold by
Byrd Marilyn F
Bought by
Byrd William Elliot and Byrd Susan Elizabeth
Purchase Details
Closed on
Oct 4, 1999
Sold by
Byrd Marilyn F and Estate Of Clyde E Byrd
Bought by
Byrd Marilyn F
Purchase Details
Closed on
Feb 9, 1999
Sold by
Alamo Heights United Methodist Church
Bought by
Byrd Marilyn F
Create a Home Valuation Report for This Property
The Home Valuation Report is an in-depth analysis detailing your home's value as well as a comparison with similar homes in the area
Home Values in the Area
Average Home Value in this Area
Purchase History
| Date | Buyer | Sale Price | Title Company |
|---|---|---|---|
| Sparklez Realty V Llc | -- | None Listed On Document | |
| Sparklez Realty V Llc | -- | None Listed On Document | |
| Murphy Home Buyers Llc | -- | None Listed On Document | |
| Byrd William Elliot | -- | None Listed On Document | |
| Byrd Marilyn F | -- | -- | |
| Byrd Marilyn F | -- | -- |
Source: Public Records
Mortgage History
| Date | Status | Borrower | Loan Amount |
|---|---|---|---|
| Open | Sparklez Realty V Llc | $200,000 | |
| Closed | Sparklez Realty V Llc | $200,000 |
Source: Public Records
Tax History Compared to Growth
Tax History
| Year | Tax Paid | Tax Assessment Tax Assessment Total Assessment is a certain percentage of the fair market value that is determined by local assessors to be the total taxable value of land and additions on the property. | Land | Improvement |
|---|---|---|---|---|
| 2025 | $11,024 | $315,000 | $226,607 | $88,393 |
| 2024 | $11,024 | $489,730 | $364,390 | $125,340 |
| 2023 | $11,024 | $480,690 | $364,390 | $116,300 |
| 2022 | $9,434 | $389,710 | $251,660 | $138,050 |
| 2021 | $8,863 | $355,120 | $218,810 | $136,310 |
| 2020 | $8,816 | $352,870 | $218,810 | $134,060 |
| 2019 | $8,958 | $350,150 | $218,810 | $134,060 |
| 2018 | $7,974 | $318,318 | $171,210 | $159,620 |
| 2017 | $7,248 | $289,380 | $121,050 | $168,330 |
| 2016 | $6,657 | $265,777 | $124,440 | $151,540 |
| 2015 | $2,420 | $241,615 | $124,440 | $138,990 |
| 2014 | $2,420 | $219,650 | $0 | $0 |
Source: Public Records
Map
Nearby Homes
- 239 E Nottingham Dr
- 204 E Nottingham Dr
- 7815 Broadway St Unit 201
- 7815 Broadway St Unit 408D
- 214 Robinhood Place
- 7711 Broadway Unit 16B
- 7711 Broadway Unit 8B
- 7711 Broadway Unit 26C
- 7731 Broadway St Unit K142
- 7731 Broadway St Unit I-42
- 7707 Broadway Unit 24A
- 7707 Broadway Unit 3
- 7897 Broadway Unit 1001
- 7887 Broadway St Unit 1102/1103
- 7887 Broadway St Unit 302
- 7926 Broadway St Unit 402
- 7926 Broadway St Unit 101
- 7926 Broadway St Unit 102
- 209 Calumet Place
- 411 E Nottingham Dr
- 280 Lorenz Rd
- 292 Lorenz Rd
- 1603 Nacogdoches Rd
- 274 Lorenz Rd
- 7502 Tondre St
- 7503 Tondre St
- 155 Knibbe Ave
- 268 Lorenz Rd
- 291 Lorenz Rd
- 151 Knibbe Ave
- 7502 Huntleigh Ln
- 7506 Tondre St
- 7507 Tondre St
- 264 Lorenz Rd
- 1703 Nacogdoches Rd
- 7506 Huntleigh Ln
- 147 Knibbe Ave
- 7511 Tondre St
- 7514 Tondre St
- 256 Lorenz Rd