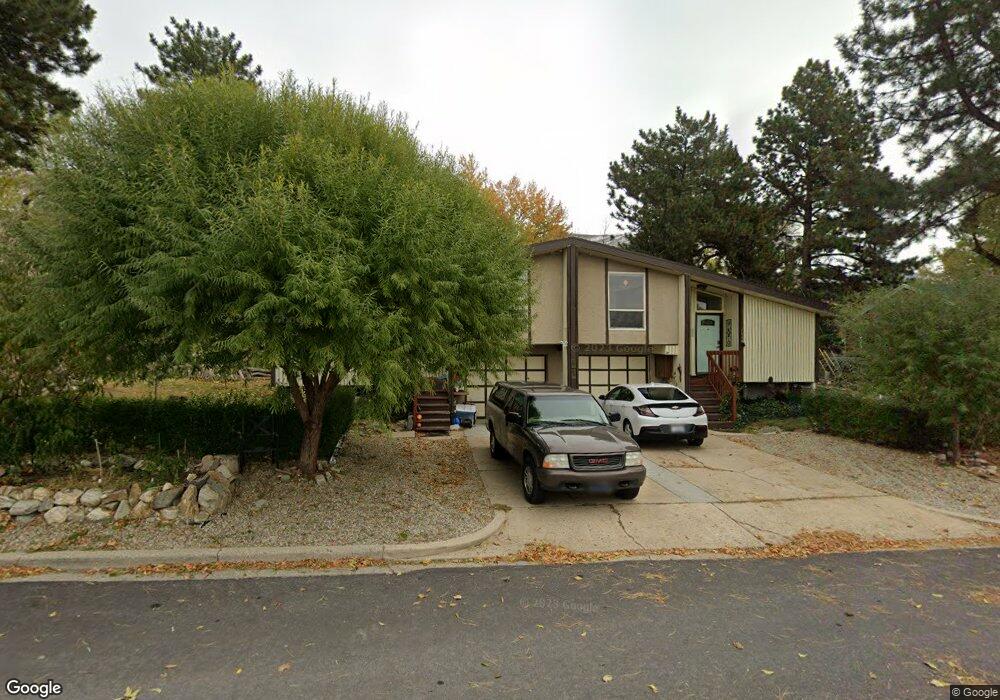
286 N 200 E Centerville, UT 84014
Estimated Value: $336,000 - $685,000
4
Beds
2
Baths
1,804
Sq Ft
$306/Sq Ft
Est. Value
About This Home
This home is located at 286 N 200 E, Centerville, UT 84014 and is currently estimated at $552,758, approximately $306 per square foot. 286 N 200 E is a home located in Davis County with nearby schools including Centerville Elementary, Centerville Jr High, and Viewmont High School.
Ownership History
Date
Name
Owned For
Owner Type
Purchase Details
Closed on
Mar 24, 2003
Sold by
Shiner Gary
Bought by
Shiner Gary and Shiner Stephanie M
Current Estimated Value
Purchase Details
Closed on
Feb 13, 1997
Sold by
Drury Darlene Brown and Drury Ashley Sara
Bought by
Shiner Gary L
Home Financials for this Owner
Home Financials are based on the most recent Mortgage that was taken out on this home.
Original Mortgage
$116,000
Outstanding Balance
$12,707
Interest Rate
7.85%
Estimated Equity
$540,051
Purchase Details
Closed on
Feb 4, 1997
Sold by
Shiner Gary L
Bought by
Shiner Gary
Home Financials for this Owner
Home Financials are based on the most recent Mortgage that was taken out on this home.
Original Mortgage
$116,000
Outstanding Balance
$12,707
Interest Rate
7.85%
Estimated Equity
$540,051
Purchase Details
Closed on
Jan 16, 1997
Sold by
Skidmore Daina H Drury and Hennessy Jami Drury
Bought by
Shiner Gary L
Home Financials for this Owner
Home Financials are based on the most recent Mortgage that was taken out on this home.
Original Mortgage
$116,000
Outstanding Balance
$12,707
Interest Rate
7.85%
Estimated Equity
$540,051
Create a Home Valuation Report for This Property
The Home Valuation Report is an in-depth analysis detailing your home's value as well as a comparison with similar homes in the area
Purchase History
| Date | Buyer | Sale Price | Title Company |
|---|---|---|---|
| Shiner Gary | -- | Backman Stewart Title Servic | |
| Shiner Gary L | -- | Bonneville Title Company Inc | |
| Shiner Gary | -- | Bonneville Title Company Inc | |
| Shiner Gary L | -- | Bonneville Title Company Inc |
Source: Public Records
Mortgage History
| Date | Status | Borrower | Loan Amount |
|---|---|---|---|
| Open | Shiner Gary | $116,000 |
Source: Public Records
Tax History
| Year | Tax Paid | Tax Assessment Tax Assessment Total Assessment is a certain percentage of the fair market value that is determined by local assessors to be the total taxable value of land and additions on the property. | Land | Improvement |
|---|---|---|---|---|
| 2025 | $3,862 | $336,050 | $157,941 | $178,109 |
| 2024 | $3,471 | $337,699 | $142,625 | $195,074 |
| 2023 | $3,368 | $325,600 | $128,193 | $197,406 |
| 2022 | $3,545 | $624,000 | $214,309 | $409,691 |
| 2021 | $2,958 | $446,000 | $180,844 | $265,156 |
| 2020 | $2,506 | $356,000 | $175,461 | $180,539 |
| 2019 | $2,667 | $350,000 | $174,678 | $175,322 |
| 2018 | $2,257 | $316,000 | $160,293 | $155,707 |
| 2016 | $1,723 | $132,385 | $55,013 | $77,372 |
| 2015 | $1,634 | $121,550 | $55,013 | $66,537 |
| 2014 | $1,386 | $101,494 | $55,013 | $46,481 |
| 2013 | -- | $119,298 | $41,993 | $77,305 |
Source: Public Records
Map
Nearby Homes
- 380 E 400 N
- 252 N 400 E
- 360 E Center St
- 295 E 500 N
- 56 W 200 N
- 328 E 1100 S
- 88 W 50 S Unit A4
- 88 W 50 S Unit C-3
- 88 W 50 S Unit B5
- 147 N 360 W Unit 21
- 282 W 605 N Unit I
- 281 W 650 N Unit B
- 67 W Pheasantbrook Dr
- 495 E 475 S
- 303 W 650 N Unit I
- 775 Pheasantbrook Cir
- 833 N Lakeside Ln
- 871 Poplar Cir
- 22 Creekside Ln
- 292 W 680 N
Your Personal Tour Guide
Ask me questions while you tour the home.