
Landlord's Agent in 2024
Adam Mancini
Ann McBride Real Estate
(860) 306-9988
6 in this area
206 Total Sales
Estimated Value: $541,822 - $693,000
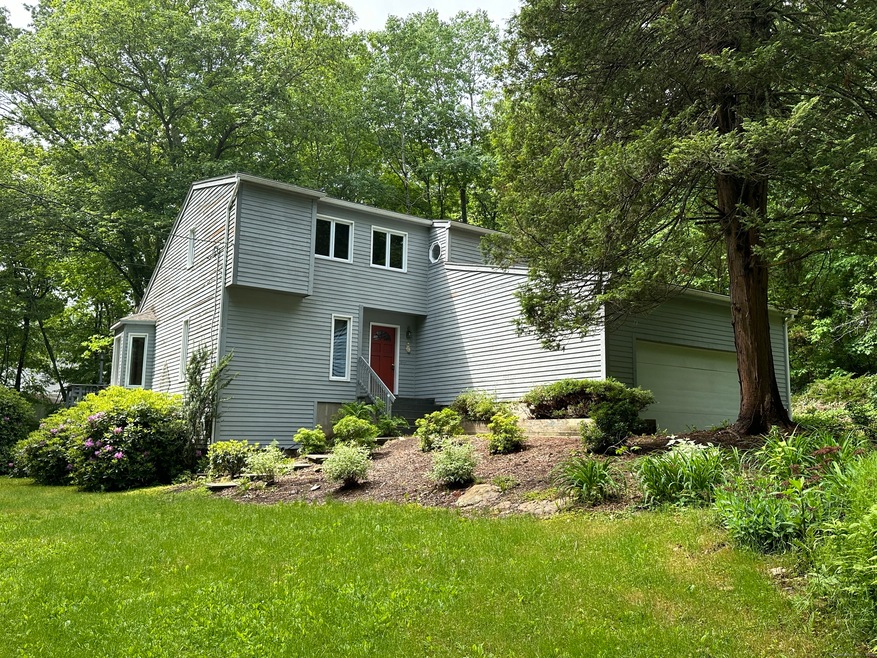
Available June 1, 2024 - pets flexible, non smoking, one year lease minimum. Privately situated 4 BR, 3 full bath Contemporary one set on a rear lot and convenient to schools, shopping and highways. Open floor plan, living room/dining room combo, cathedral ceilings and wooded views, spacious eat-in kitchen, walk in pantry, heated sunroom with skylights and brick floor, first floor bedroom and full bath. Upstairs primary BR with two additional bedrooms.
Last Agent to Rent the Property
Ann McBride Real Estate License #REB.0751610 Listed on: 05/29/2024
| Date | Buyer | Sale Price | Title Company |
|---|---|---|---|
| Garrett Leann | $340,000 | -- | |
| Quirino Richard | $405,000 | -- |
| Date | Status | Borrower | Loan Amount |
|---|---|---|---|
| Open | Quirino Richard | $272,000 | |
| Previous Owner | Quirino Richard | $324,000 | |
| Previous Owner | Quirino Richard | $82,000 |
| Date | Event | Price | List to Sale | Price per Sq Ft |
|---|---|---|---|---|
| 07/01/2024 07/01/24 | Rented | $3,000 | -6.3% | -- |
| 06/09/2024 06/09/24 | Under Contract | -- | -- | -- |
| 05/29/2024 05/29/24 | For Rent | $3,200 | -- | -- |
| Year | Tax Paid | Tax Assessment Tax Assessment Total Assessment is a certain percentage of the fair market value that is determined by local assessors to be the total taxable value of land and additions on the property. | Land | Improvement |
|---|---|---|---|---|
| 2025 | $7,749 | $276,640 | $105,630 | $171,010 |
| 2024 | $7,289 | $276,640 | $105,630 | $171,010 |
| 2023 | $6,883 | $276,640 | $105,630 | $171,010 |
| 2022 | $6,595 | $276,640 | $105,630 | $171,010 |
| 2021 | $6,708 | $235,270 | $100,310 | $134,960 |
| 2020 | $6,772 | $238,770 | $100,310 | $138,460 |
| 2019 | $6,731 | $238,770 | $100,310 | $138,460 |
| 2018 | $6,530 | $238,770 | $100,310 | $138,460 |
| 2017 | $6,246 | $238,770 | $100,310 | $138,460 |
| 2016 | $5,970 | $235,410 | $95,060 | $140,350 |
| 2015 | $5,817 | $235,410 | $95,060 | $140,350 |
| 2014 | $5,657 | $235,410 | $95,060 | $140,350 |
Landlord's Agent in 2024
Adam Mancini
Ann McBride Real Estate
(860) 306-9988
6 in this area
206 Total Sales
Source: SmartMLS
MLS Number: 24018938
APN: 24.0 126
Disclaimer: Certain information contained herein is derived from information provided by parties other than Homes.com. All information provided is deemed reliable, but is not guaranteed to be accurate and should be independently verified.
![]() IDX information is provided exclusively for personal, non-commercial use, and may not be used for any purpose other than to identify prospective properties consumers may be interested in purchasing. Information is deemed reliable but not guaranteed.
IDX information is provided exclusively for personal, non-commercial use, and may not be used for any purpose other than to identify prospective properties consumers may be interested in purchasing. Information is deemed reliable but not guaranteed.