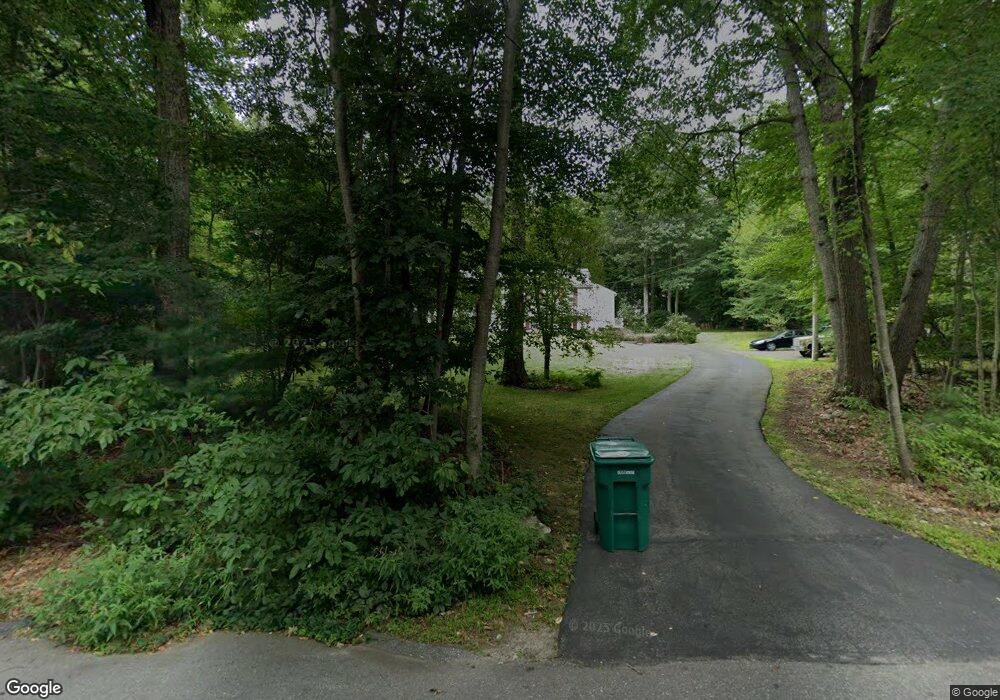
286 Richardson St Uxbridge, MA 01569
Estimated Value: $565,366 - $641,000
3
Beds
1
Bath
1,856
Sq Ft
$327/Sq Ft
Est. Value
About This Home
This home is located at 286 Richardson St, Uxbridge, MA 01569 and is currently estimated at $606,342, approximately $326 per square foot. 286 Richardson St is a home located in Worcester County with nearby schools including Uxbridge High School and Our Lady of the Valley Regional School.
Ownership History
Date
Name
Owned For
Owner Type
Purchase Details
Closed on
Aug 3, 2023
Sold by
Lamphere Richard A
Bought by
Richard A Lamphere Jr Ret and Lamphere
Current Estimated Value
Purchase Details
Closed on
Jan 8, 2021
Sold by
Prockette Cynthia A and Lamphere Richard A
Bought by
Lamphere Richard A
Home Financials for this Owner
Home Financials are based on the most recent Mortgage that was taken out on this home.
Original Mortgage
$203,000
Interest Rate
2.71%
Mortgage Type
Stand Alone Refi Refinance Of Original Loan
Purchase Details
Closed on
Aug 1, 2012
Sold by
Lampher Richard A
Bought by
Lampher Richard A and Porckette Cynthia A
Purchase Details
Closed on
May 4, 1998
Sold by
Millette Normand R
Bought by
Lamphere Richard A
Home Financials for this Owner
Home Financials are based on the most recent Mortgage that was taken out on this home.
Original Mortgage
$90,000
Interest Rate
7.04%
Mortgage Type
Purchase Money Mortgage
Create a Home Valuation Report for This Property
The Home Valuation Report is an in-depth analysis detailing your home's value as well as a comparison with similar homes in the area
Home Values in the Area
Average Home Value in this Area
Purchase History
| Date | Buyer | Sale Price | Title Company |
|---|---|---|---|
| Richard A Lamphere Jr Ret | -- | None Available | |
| Lamphere Richard A | -- | None Available | |
| Lampher Richard A | -- | -- | |
| Lamphere Richard A | $149,500 | -- |
Source: Public Records
Mortgage History
| Date | Status | Borrower | Loan Amount |
|---|---|---|---|
| Previous Owner | Lamphere Richard A | $203,000 | |
| Previous Owner | Lamphere Richard A | $90,000 |
Source: Public Records
Tax History Compared to Growth
Tax History
| Year | Tax Paid | Tax Assessment Tax Assessment Total Assessment is a certain percentage of the fair market value that is determined by local assessors to be the total taxable value of land and additions on the property. | Land | Improvement |
|---|---|---|---|---|
| 2025 | $63 | $480,400 | $153,000 | $327,400 |
| 2024 | $6,106 | $472,600 | $145,200 | $327,400 |
| 2023 | $5,867 | $420,600 | $125,600 | $295,000 |
| 2022 | $5,796 | $382,300 | $109,900 | $272,400 |
| 2021 | $5,876 | $371,400 | $107,500 | $263,900 |
| 2020 | $5,757 | $343,900 | $106,000 | $237,900 |
| 2019 | $5,899 | $340,000 | $106,000 | $234,000 |
| 2018 | $5,620 | $327,300 | $106,000 | $221,300 |
| 2017 | $5,631 | $332,000 | $103,700 | $228,300 |
| 2016 | $5,492 | $312,600 | $95,000 | $217,600 |
| 2015 | $5,340 | $306,900 | $95,000 | $211,900 |
Source: Public Records
Map
Nearby Homes
- 106 Mantell Rd
- 97 Mantell Rd
- 88 Mantell Rd
- 179 Crownshield Ave Unit C
- 33 Cotton Mill Way Unit 33
- The Contemporary Villager Plan at Patriot's Landing
- Karenrose Sunnery Plan at Patriot's Landing
- 3 Highness Dr Unit 3
- 70 Chocolog Rd
- 346 Millville Rd
- 288 High St
- 46 Turner Farm Rd
- 18 Turner Farm Rd
- 12 Turner Farm Rd
- 19 Surry Dr
- 10 Old Millville Rd
- 117 Turner Farm Rd
- 127 Turner Farm Rd
- 37 Pine Grove Cir
- 95 High St Unit F
- 276 Richardson St
- 300 Richardson St
- 296 Richardson St
- 314 Richardson St
- 82 Old Richardson St
- 85 Old Richardson St
- 85 Old Richardson St
- 81 Old Richardson St
- 240 Richardson St
- 340 Richardson St
- 71 Old Richardson St
- 44 Old Richardson St
- 0000 Confidential St
- Rt 16 Uxbridge
- Rt 16 Uxbridge Unit 1
- 71-73 Sout Main St
- 0 Lot 122 Hunter Rd Unit 30062371
- 5 Freedoms Way
- 153 Mill St
- 43 Old Richardson St