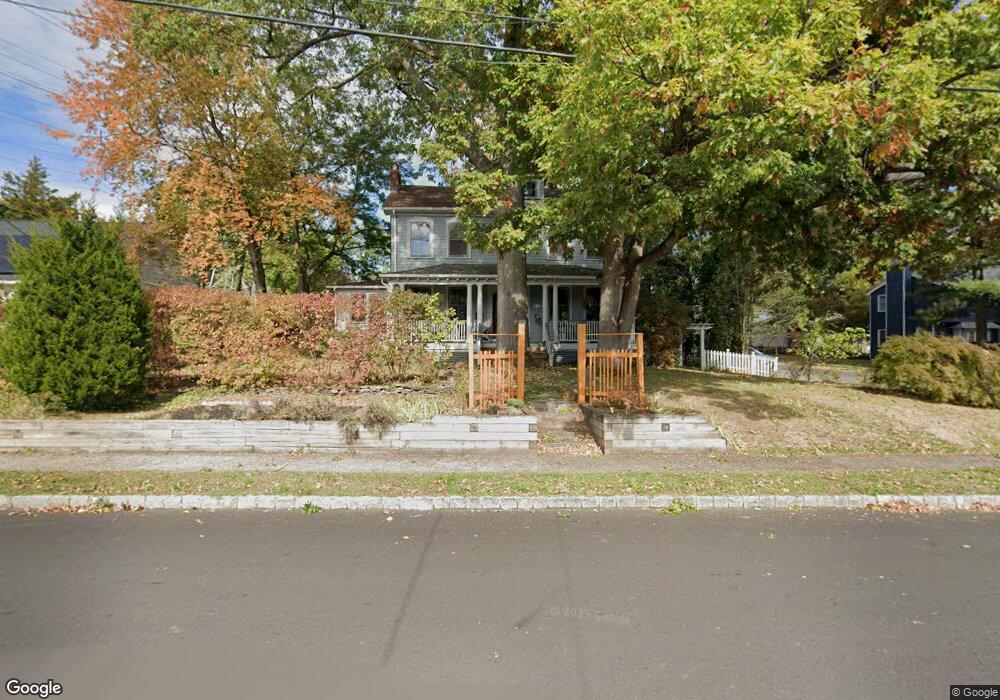
286 Sylvan Rd Bloomfield, NJ 07003
Estimated Value: $703,000 - $830,000
Studio
--
Bath
2,290
Sq Ft
$337/Sq Ft
Est. Value
About This Home
This home is located at 286 Sylvan Rd, Bloomfield, NJ 07003 and is currently estimated at $770,751, approximately $336 per square foot. 286 Sylvan Rd is a home located in Essex County with nearby schools including Oak View School, Bloomfield Middle School, and Bloomfield High School.
Ownership History
Date
Name
Owned For
Owner Type
Purchase Details
Closed on
Dec 12, 2000
Sold by
Greene Michael
Bought by
Grady Robert L and Chan Alashia L
Current Estimated Value
Home Financials for this Owner
Home Financials are based on the most recent Mortgage that was taken out on this home.
Original Mortgage
$229,950
Outstanding Balance
$84,739
Interest Rate
7.7%
Estimated Equity
$686,012
Purchase Details
Closed on
Jan 20, 1993
Sold by
Carbone Lillian and Carbone Livia
Bought by
Greene Michael and Greene Michelle
Create a Home Valuation Report for This Property
The Home Valuation Report is an in-depth analysis detailing your home's value as well as a comparison with similar homes in the area
Home Values in the Area
Average Home Value in this Area
Purchase History
| Date | Buyer | Sale Price | Title Company |
|---|---|---|---|
| Grady Robert L | $255,500 | -- | |
| Greene Michael | $140,000 | -- |
Source: Public Records
Mortgage History
| Date | Status | Borrower | Loan Amount |
|---|---|---|---|
| Open | Grady Robert L | $229,950 |
Source: Public Records
Tax History
| Year | Tax Paid | Tax Assessment Tax Assessment Total Assessment is a certain percentage of the fair market value that is determined by local assessors to be the total taxable value of land and additions on the property. | Land | Improvement |
|---|---|---|---|---|
| 2025 | $14,709 | $450,100 | $215,300 | $234,800 |
| 2024 | $14,709 | $450,100 | $215,300 | $234,800 |
| 2022 | $14,412 | $450,100 | $215,300 | $234,800 |
| 2021 | $17,406 | $553,800 | $215,300 | $338,500 |
| 2020 | $17,140 | $553,800 | $215,300 | $338,500 |
| 2019 | $15,068 | $378,500 | $192,000 | $186,500 |
| 2018 | $15,004 | $378,500 | $192,000 | $186,500 |
| 2017 | $14,777 | $378,500 | $192,000 | $186,500 |
| 2016 | $14,610 | $378,500 | $192,000 | $186,500 |
| 2015 | $14,478 | $378,500 | $192,000 | $186,500 |
| 2014 | $14,213 | $378,500 | $192,000 | $186,500 |
Source: Public Records
Map
Nearby Homes
- 330 W Passaic Ave
- 147 Knollwood Terrace
- 355 W Passaic Ave
- 96 Orchard Dr
- 1 Rutan Place
- 80 Rhoda Ave
- 45 Marlboro Rd
- 23 Sussex Rd
- 10 Burlington Rd
- 3 Collins Ave
- 49 New Brier Ln
- 30 Andover Place
- 18 Farmingdale Ave
- 9 New Brier Ln
- 31 Emily Ave
- 741 Bloomfield Ave
- 7 Chaplin Ct
- 723 Bloomfield Ave
- 585 Mount Prospect Ave
- 15 Peru Rd
Your Personal Tour Guide
Ask me questions while you tour the home.