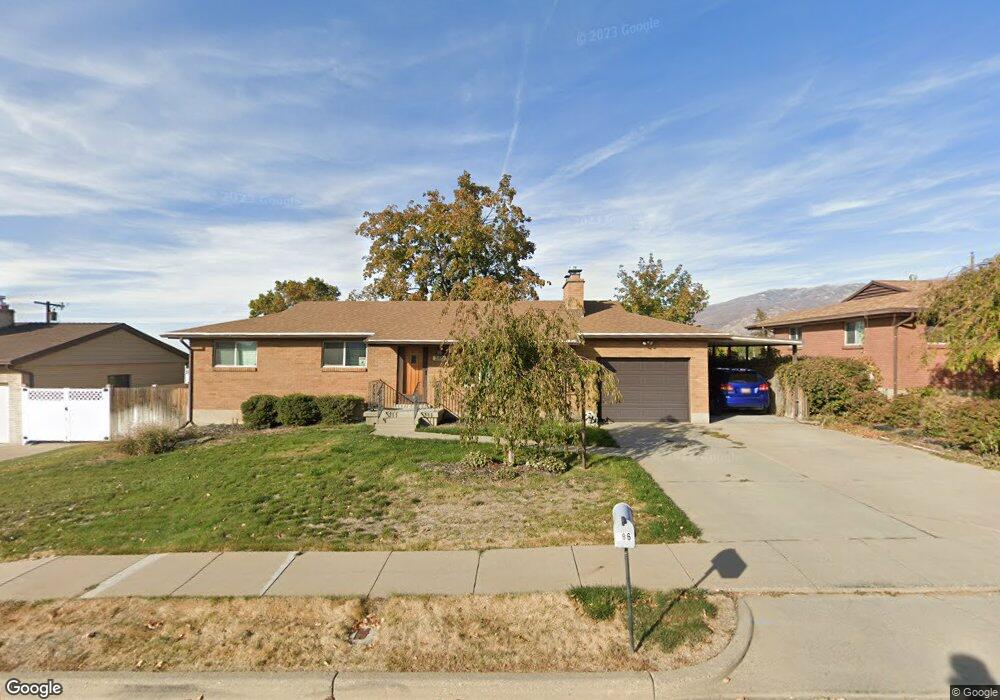
286 W 2300 S Bountiful, UT 84010
Estimated Value: $517,000 - $575,000
5
Beds
3
Baths
2,252
Sq Ft
$244/Sq Ft
Est. Value
About This Home
This home is located at 286 W 2300 S, Bountiful, UT 84010 and is currently estimated at $550,328, approximately $244 per square foot. 286 W 2300 S is a home located in Davis County with nearby schools including Boulton School, South Davis Junior High School, and Woods Cross High School.
Ownership History
Date
Name
Owned For
Owner Type
Purchase Details
Closed on
May 29, 2020
Sold by
Hale Spencer and Hale Jessica
Bought by
Burkhart Cynthia B
Current Estimated Value
Home Financials for this Owner
Home Financials are based on the most recent Mortgage that was taken out on this home.
Original Mortgage
$205,900
Outstanding Balance
$182,456
Interest Rate
3.3%
Mortgage Type
New Conventional
Estimated Equity
$367,872
Purchase Details
Closed on
Nov 22, 2016
Sold by
Alexander Matthew J
Bought by
Hale Spencer and Hale Jessica
Purchase Details
Closed on
Apr 20, 2016
Sold by
Alexander Trust
Bought by
Alexander Trust
Purchase Details
Closed on
Dec 6, 2013
Sold by
Dyer James Allan
Bought by
Alexander Matthew J
Home Financials for this Owner
Home Financials are based on the most recent Mortgage that was taken out on this home.
Original Mortgage
$194,413
Interest Rate
4.25%
Mortgage Type
FHA
Purchase Details
Closed on
Dec 13, 2001
Sold by
Dyer Gary A
Bought by
Dyer Gary A and The Gary A Dyer Trust
Create a Home Valuation Report for This Property
The Home Valuation Report is an in-depth analysis detailing your home's value as well as a comparison with similar homes in the area
Purchase History
| Date | Buyer | Sale Price | Title Company |
|---|---|---|---|
| Burkhart Cynthia B | -- | North American Title | |
| Hale Spencer | -- | Vanguard Title | |
| Alexander Trust | -- | First American Title | |
| Alexander Matthew J | -- | None Available | |
| Dyer Gary A | -- | -- |
Source: Public Records
Mortgage History
| Date | Status | Borrower | Loan Amount |
|---|---|---|---|
| Open | Burkhart Cynthia B | $205,900 | |
| Previous Owner | Alexander Matthew J | $194,413 |
Source: Public Records
Tax History
| Year | Tax Paid | Tax Assessment Tax Assessment Total Assessment is a certain percentage of the fair market value that is determined by local assessors to be the total taxable value of land and additions on the property. | Land | Improvement |
|---|---|---|---|---|
| 2025 | $2,104 | $288,750 | $122,184 | $166,566 |
| 2024 | $1,928 | $277,750 | $106,323 | $171,427 |
| 2023 | $1,756 | $465,000 | $198,290 | $266,710 |
| 2022 | $2,416 | $281,051 | $109,005 | $172,046 |
| 2021 | $2,074 | $393,000 | $142,542 | $250,458 |
| 2020 | $1,672 | $333,000 | $122,650 | $210,350 |
| 2019 | $2,227 | $311,000 | $135,726 | $175,274 |
| 2018 | $2,083 | $286,000 | $133,189 | $152,811 |
| 2016 | $1,649 | $121,550 | $53,407 | $68,143 |
| 2015 | $1,582 | $109,890 | $53,407 | $56,483 |
| 2014 | $1,512 | $107,870 | $53,407 | $54,463 |
| 2013 | -- | $96,343 | $41,880 | $54,463 |
Source: Public Records
Map
Nearby Homes
- 304 W 2300 S
- 2095 S Main St Unit 13
- 1950 S 200 W Unit 32
- 404 W 2700 S
- 2749 S 450 W
- 33 W Wicker Ln
- 19 E North Canyon Rd
- 2064 S Orchard Dr
- 337 W 2900 S
- 69 E North Canyon Rd
- 53 W 1800 S
- 1820 S 50 W
- 544 W 2900 S
- 552 W 2900 S
- 554 W 2900 S
- 188 E 2050 S Unit D3
- 320 E 2100 S
- 2008 S 700 W
- 291 E 1950 S
- 2046 S 350 E Unit 4
Your Personal Tour Guide
Ask me questions while you tour the home.