286 W 3775 S Vernal, UT 84078
Estimated Value: $334,315 - $525,000
--
Bed
--
Bath
1,702
Sq Ft
$256/Sq Ft
Est. Value
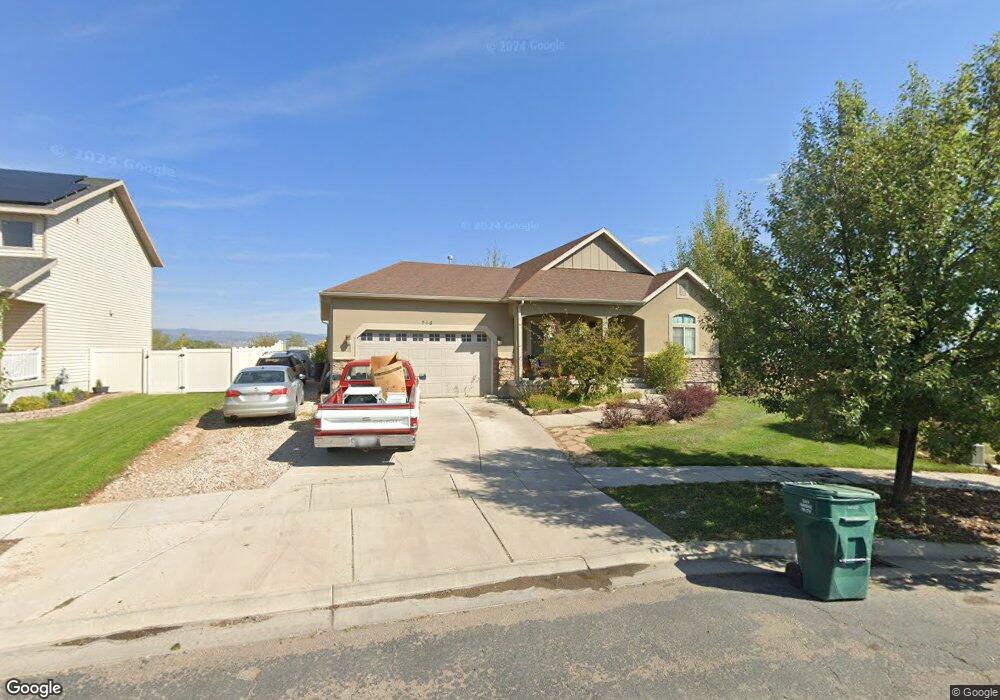
About This Home
This home is located at 286 W 3775 S, Vernal, UT 84078 and is currently estimated at $436,329, approximately $256 per square foot. 286 W 3775 S is a home with nearby schools including Davis School, Vernal Middle School, and Uintah Middle School.
Ownership History
Date
Name
Owned For
Owner Type
Purchase Details
Closed on
Dec 31, 2008
Sold by
Sumsion Darrin D
Bought by
Sumsion Darrin D and Sumsion Adrienne A
Current Estimated Value
Home Financials for this Owner
Home Financials are based on the most recent Mortgage that was taken out on this home.
Original Mortgage
$259,968
Outstanding Balance
$171,633
Interest Rate
6.03%
Mortgage Type
FHA
Estimated Equity
$264,696
Purchase Details
Closed on
Dec 30, 2008
Sold by
Cottage Real Estate & Construtction Corp
Bought by
Sumsion Darrin D
Home Financials for this Owner
Home Financials are based on the most recent Mortgage that was taken out on this home.
Original Mortgage
$259,968
Outstanding Balance
$171,633
Interest Rate
6.03%
Mortgage Type
FHA
Estimated Equity
$264,696
Purchase Details
Closed on
Aug 1, 2008
Sold by
Hawkeye Developers Llc
Bought by
Cottage Real Estate & Construction Corp
Home Financials for this Owner
Home Financials are based on the most recent Mortgage that was taken out on this home.
Original Mortgage
$3,000,000
Interest Rate
6.41%
Mortgage Type
Construction
Create a Home Valuation Report for This Property
The Home Valuation Report is an in-depth analysis detailing your home's value as well as a comparison with similar homes in the area
Home Values in the Area
Average Home Value in this Area
Purchase History
| Date | Buyer | Sale Price | Title Company |
|---|---|---|---|
| Sumsion Darrin D | -- | -- | |
| Sumsion Darrin D | -- | -- | |
| Cottage Real Estate & Construction Corp | -- | -- |
Source: Public Records
Mortgage History
| Date | Status | Borrower | Loan Amount |
|---|---|---|---|
| Open | Sumsion Darrin D | $259,968 | |
| Previous Owner | Cottage Real Estate & Construction Corp | $3,000,000 |
Source: Public Records
Tax History Compared to Growth
Tax History
| Year | Tax Paid | Tax Assessment Tax Assessment Total Assessment is a certain percentage of the fair market value that is determined by local assessors to be the total taxable value of land and additions on the property. | Land | Improvement |
|---|---|---|---|---|
| 2024 | $1,810 | $215,419 | $15,075 | $200,344 |
| 2023 | $1,810 | $187,785 | $15,075 | $172,710 |
| 2022 | $1,581 | $153,243 | $15,075 | $138,168 |
| 2021 | $1,637 | $71,618 | $8,291 | $63,327 |
| 2020 | $1,555 | $127,034 | $19,250 | $107,784 |
| 2019 | $1,574 | $127,034 | $19,250 | $107,784 |
| 2018 | $1,508 | $121,901 | $19,250 | $102,651 |
| 2017 | $1,480 | $121,901 | $19,250 | $102,651 |
| 2016 | $1,409 | $125,076 | $19,250 | $105,826 |
| 2015 | $1,284 | $123,710 | $19,250 | $104,460 |
| 2014 | $1,208 | $117,797 | $19,250 | $98,547 |
| 2013 | $1,206 | $115,047 | $16,500 | $98,547 |
Source: Public Records
Map
Nearby Homes
- 300 W 3775 S Unit 211
- 300 W 3775 S Unit .18
- 300 W 3775 S
- 312 W 3775 S Unit 210
- 312 W 3775 S
- 3793 S 275 W
- 326 W 3775 S Unit 209
- 326 W 3775 S
- 3789 S 330 W Unit 222
- 3789 S 330 W
- 3804 S 275 W Unit 220
- 3805 S 275 W
- 338 W 3775 S Unit 208
- 338 W 3775 S
- 3803 S 330 W Unit 223
- 3803 S 330 W
- 3816 S 275 W Unit 219
- 3816 S 275 W
- 3815 S 330 W Unit 318
- 3821 S 275 W