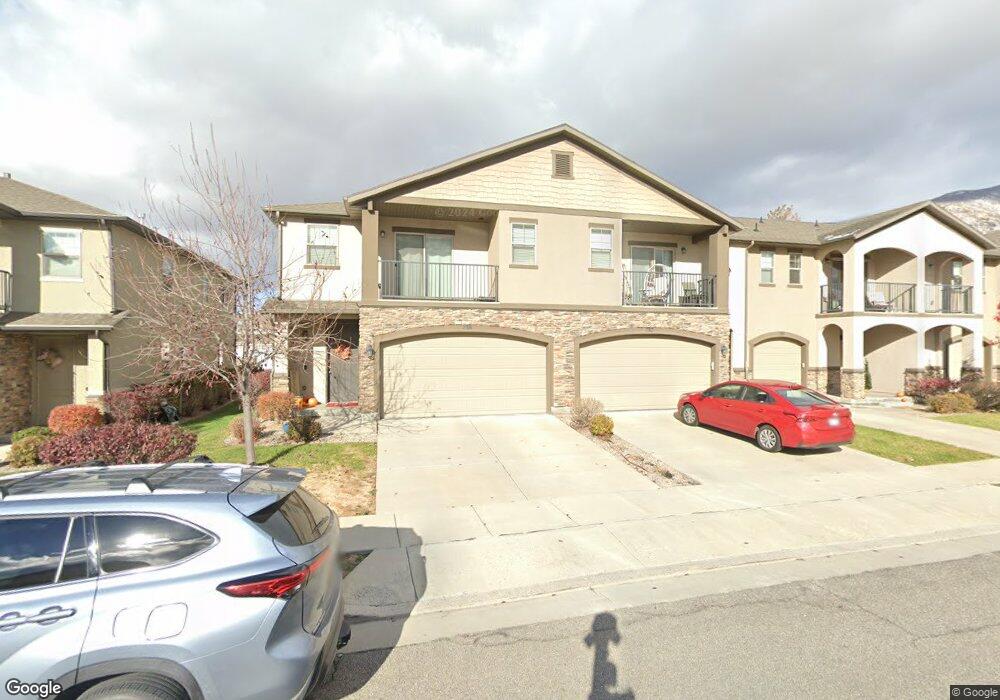
286 W 710 N Unit 205A Centerville, UT 84014
Estimated Value: $449,000 - $501,000
3
Beds
3
Baths
1,768
Sq Ft
$268/Sq Ft
Est. Value
About This Home
This home is located at 286 W 710 N Unit 205A, Centerville, UT 84014 and is currently estimated at $474,558, approximately $268 per square foot. 286 W 710 N Unit 205A is a home located in Davis County with nearby schools including Centerville Elementary, Centerville Jr High, and Viewmont High School.
Ownership History
Date
Name
Owned For
Owner Type
Purchase Details
Closed on
Dec 2, 2019
Sold by
Dobson Brent Neeley and Dobson Dawna Allene
Bought by
D & B Family Properties Llc
Current Estimated Value
Purchase Details
Closed on
Sep 18, 2019
Sold by
Dobson Brent N and Dobson Dawna A
Bought by
Dobson Brent Neeley and Dobson Dawna Allene
Purchase Details
Closed on
Jun 27, 2019
Sold by
Cook Jason D and Cook Adriana
Bought by
Dobson Brent N and Dobson Dawna A
Home Financials for this Owner
Home Financials are based on the most recent Mortgage that was taken out on this home.
Original Mortgage
$130,800
Interest Rate
4%
Mortgage Type
New Conventional
Purchase Details
Closed on
Jun 19, 2013
Sold by
Cook Jason D
Bought by
Cook Jason D and Cook Adriana
Home Financials for this Owner
Home Financials are based on the most recent Mortgage that was taken out on this home.
Original Mortgage
$202,229
Interest Rate
3.37%
Mortgage Type
FHA
Create a Home Valuation Report for This Property
The Home Valuation Report is an in-depth analysis detailing your home's value as well as a comparison with similar homes in the area
Home Values in the Area
Average Home Value in this Area
Purchase History
| Date | Buyer | Sale Price | Title Company |
|---|---|---|---|
| D & B Family Properties Llc | -- | None Available | |
| Dobson Brent Neeley | -- | None Available | |
| Dobson Brent N | -- | Aspen Title Insurance | |
| Cook Jason D | -- | Bonneville Superior Title Co | |
| Cook Jason D | -- | Bonneville Superior Title Co |
Source: Public Records
Mortgage History
| Date | Status | Borrower | Loan Amount |
|---|---|---|---|
| Previous Owner | Dobson Brent N | $130,800 | |
| Previous Owner | Cook Jason D | $202,229 |
Source: Public Records
Tax History Compared to Growth
Tax History
| Year | Tax Paid | Tax Assessment Tax Assessment Total Assessment is a certain percentage of the fair market value that is determined by local assessors to be the total taxable value of land and additions on the property. | Land | Improvement |
|---|---|---|---|---|
| 2025 | $2,553 | $244,200 | $72,050 | $172,150 |
| 2024 | $2,448 | $238,150 | $55,000 | $183,150 |
| 2023 | $2,514 | $243,100 | $53,900 | $189,200 |
| 2022 | $2,631 | $463,000 | $96,000 | $367,000 |
| 2021 | $2,348 | $354,000 | $69,000 | $285,000 |
| 2020 | $2,089 | $315,000 | $64,500 | $250,500 |
| 2019 | $2,044 | $301,000 | $62,000 | $239,000 |
| 2018 | $1,925 | $264,000 | $58,000 | $206,000 |
| 2016 | $1,535 | $115,225 | $15,015 | $100,210 |
| 2015 | $1,516 | $107,250 | $15,015 | $92,235 |
| 2014 | $1,489 | $107,643 | $15,015 | $92,628 |
| 2013 | -- | $27,300 | $27,300 | $0 |
Source: Public Records
Map
Nearby Homes