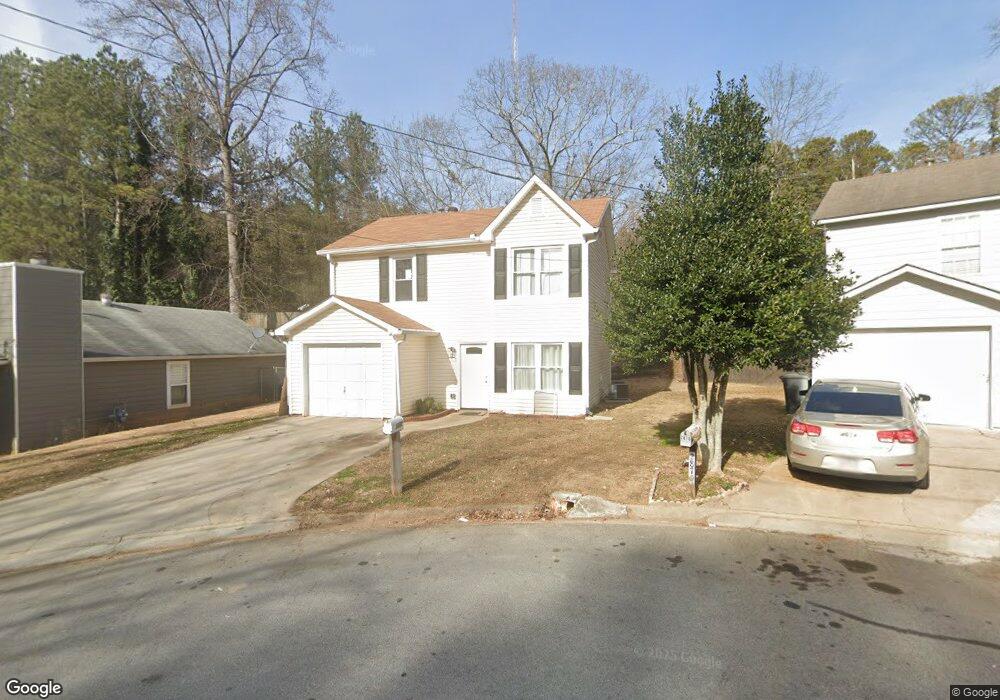
2860 Pebblebrook Ct Buford, GA 30518
Estimated Value: $283,000 - $299,000
3
Beds
2
Baths
1,254
Sq Ft
$234/Sq Ft
Est. Value
About This Home
This home is located at 2860 Pebblebrook Ct, Buford, GA 30518 and is currently estimated at $293,104, approximately $233 per square foot. 2860 Pebblebrook Ct is a home located in Gwinnett County with nearby schools including Buford Elementary School, Buford Senior Academy, and Buford Academy.
Ownership History
Date
Name
Owned For
Owner Type
Purchase Details
Closed on
Aug 29, 2024
Sold by
Jaramillo Ivonne Burgos
Bought by
Jaramillo Burgos Matilde and Burgos Cruz Bernardo
Current Estimated Value
Purchase Details
Closed on
Mar 18, 2011
Sold by
Hud & Housing Of Urban Dev
Bought by
Jaramillo Ivonne B
Purchase Details
Closed on
Nov 2, 2010
Sold by
Chase Hm Fin Llc
Bought by
Hud-Housing Of Urban Dev
Purchase Details
Closed on
Apr 30, 2008
Sold by
Federal National Mortgage Association
Bought by
Babb James and Howard Ashley
Home Financials for this Owner
Home Financials are based on the most recent Mortgage that was taken out on this home.
Original Mortgage
$86,148
Interest Rate
5.82%
Mortgage Type
FHA
Purchase Details
Closed on
Jan 3, 2006
Sold by
Chase Hm Fin Llc
Bought by
Federal Natl Mtg Assn Fnma
Create a Home Valuation Report for This Property
The Home Valuation Report is an in-depth analysis detailing your home's value as well as a comparison with similar homes in the area
Home Values in the Area
Average Home Value in this Area
Purchase History
| Date | Buyer | Sale Price | Title Company |
|---|---|---|---|
| Jaramillo Burgos Matilde | -- | -- | |
| Jaramillo Ivonne B | $41,500 | -- | |
| Hud-Housing Of Urban Dev | -- | -- | |
| Chase Hm Fin Llc | $92,227 | -- | |
| Babb James | -- | -- | |
| Federal Natl Mtg Assn Fnma | -- | -- | |
| Chase Hm Fin Llc | $68,143 | -- |
Source: Public Records
Mortgage History
| Date | Status | Borrower | Loan Amount |
|---|---|---|---|
| Previous Owner | Babb James | $86,148 |
Source: Public Records
Tax History
| Year | Tax Paid | Tax Assessment Tax Assessment Total Assessment is a certain percentage of the fair market value that is determined by local assessors to be the total taxable value of land and additions on the property. | Land | Improvement |
|---|---|---|---|---|
| 2025 | $1,594 | $111,080 | $26,800 | $84,280 |
| 2024 | $1,498 | $104,360 | $19,600 | $84,760 |
| 2023 | $1,498 | $104,360 | $19,600 | $84,760 |
| 2022 | $1,173 | $81,760 | $16,000 | $65,760 |
| 2021 | $715 | $49,840 | $8,000 | $41,840 |
| 2020 | $715 | $49,840 | $8,000 | $41,840 |
| 2019 | $578 | $44,640 | $8,000 | $36,640 |
| 2018 | $578 | $44,640 | $8,000 | $36,640 |
| 2016 | $367 | $28,600 | $4,000 | $24,600 |
| 2015 | $343 | $25,840 | $4,000 | $21,840 |
| 2014 | $244 | $18,080 | $3,000 | $15,080 |
Source: Public Records
Map
Nearby Homes
- 2938 Pebblebrook Dr
- 3016 Pebblebrook Dr
- 3020 Pebblebrook Dr
- 2710 Blake Towers Ln
- 2416 Loughridge Dr
- 2838 N Bogan Rd
- 4375 Easter Lily Ave
- Lot 2 Thunder Rd
- Lot 3 Thunder Rd
- 2802 Lakeview Ct
- 406 Thunder Rd
- 3016 Sea Aster Way
- 2678 N Bogan Rd
- 3263 N Bogan Rd NE
- 3267 N Bogan Rd NE
- 4238 Hamilton Mill Rd
- 575 Forest St
- 4184 Thompson Mill Rd
- 1049 Caruso Dr
- 1098 Caruso Dr
- 2850 Pebblebrook Ct
- 2870 Pebblebrook Ct
- 2840 Pebblebrook Ct
- 2880 Pebblebrook Ct
- 2830 Pebblebrook Ct
- 2881 Pebblebrook Ct
- 2861 Pebblebrook Ct
- 2820 Pebblebrook Ct
- 2841 Pebblebrook Ct
- 2871 Pebblebrook Ct Unit 4B
- 2831 Pebblebrook Ct
- 2810 Pebblebrook Ct
- 2870 Sundance Ct
- 2821 Pebblebrook Ct
- 2874 Sundance Ct
- 2811 Pebblebrook Ct
- 2801 Pebblebrook Ct
- 2875 Sundance Ct
- 2877 Waverly Cove Unit 1
- 2878 Sundance Ct
Your Personal Tour Guide
Ask me questions while you tour the home.