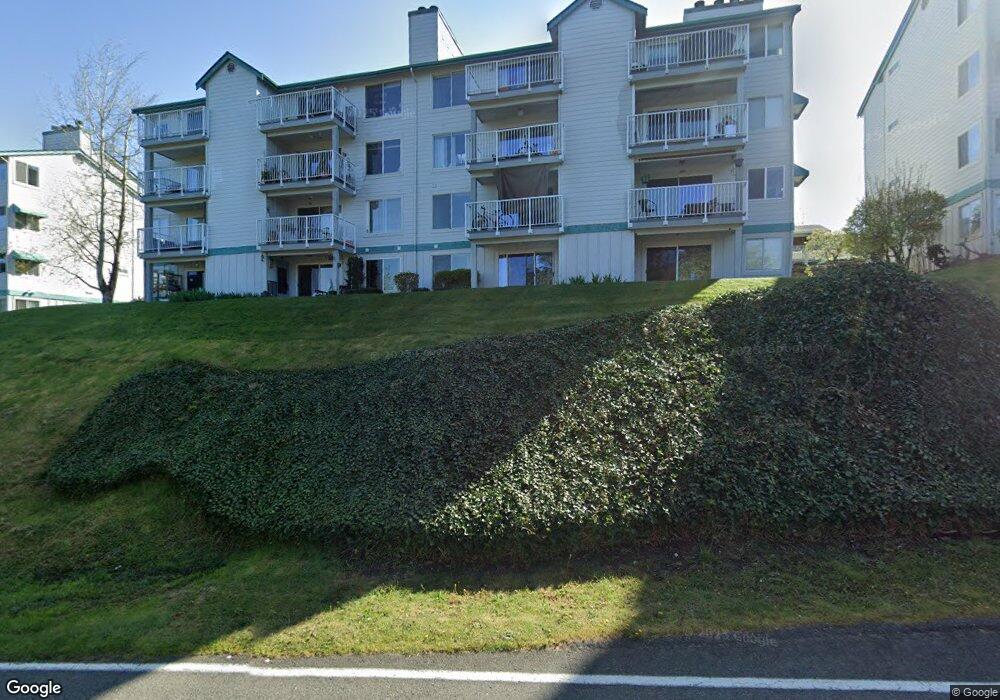
28606 16th Ave S Unit 286023 Federal Way, WA 98003
Redondo-Federal Way NeighborhoodEstimated Value: $260,000 - $300,000
2
Beds
2
Baths
888
Sq Ft
$308/Sq Ft
Est. Value
About This Home
This home is located at 28606 16th Ave S Unit 286023, Federal Way, WA 98003 and is currently estimated at $273,709, approximately $308 per square foot. 28606 16th Ave S Unit 286023 is a home located in King County with nearby schools including Woodmont K-8 School, Sacajawea Middle School, and Federal Way High School.
Ownership History
Date
Name
Owned For
Owner Type
Purchase Details
Closed on
Jun 15, 2020
Sold by
Sola Phung P
Bought by
Ray Elaine N
Current Estimated Value
Home Financials for this Owner
Home Financials are based on the most recent Mortgage that was taken out on this home.
Original Mortgage
$214,700
Outstanding Balance
$190,315
Interest Rate
3.2%
Mortgage Type
New Conventional
Estimated Equity
$83,394
Purchase Details
Closed on
Aug 4, 2015
Sold by
Werre Kimberly L
Bought by
Sola Phung P
Home Financials for this Owner
Home Financials are based on the most recent Mortgage that was taken out on this home.
Original Mortgage
$107,200
Interest Rate
3.98%
Purchase Details
Closed on
Sep 9, 2003
Sold by
Youngchild Kristine M
Bought by
Werre Kimberly L
Home Financials for this Owner
Home Financials are based on the most recent Mortgage that was taken out on this home.
Original Mortgage
$133,950
Interest Rate
3.87%
Purchase Details
Closed on
May 17, 1993
Sold by
A C and Harbor Crest L B
Bought by
Youngchild Kristine M
Create a Home Valuation Report for This Property
The Home Valuation Report is an in-depth analysis detailing your home's value as well as a comparison with similar homes in the area
Home Values in the Area
Average Home Value in this Area
Purchase History
| Date | Buyer | Sale Price | Title Company |
|---|---|---|---|
| Ray Elaine N | $226,000 | Jetclosing Inc A T&E Co | |
| Sola Phung P | -- | Chicago Title | |
| Werre Kimberly L | $141,000 | Chicago Title | |
| Youngchild Kristine M | $100,000 | -- |
Source: Public Records
Mortgage History
| Date | Status | Borrower | Loan Amount |
|---|---|---|---|
| Open | Ray Elaine N | $214,700 | |
| Previous Owner | Sola Phung P | $107,200 | |
| Previous Owner | Werre Kimberly L | $133,950 |
Source: Public Records
Tax History Compared to Growth
Tax History
| Year | Tax Paid | Tax Assessment Tax Assessment Total Assessment is a certain percentage of the fair market value that is determined by local assessors to be the total taxable value of land and additions on the property. | Land | Improvement |
|---|---|---|---|---|
| 2024 | $3,236 | $297,000 | $24,200 | $272,800 |
| 2023 | $2,600 | $289,000 | $16,600 | $272,400 |
| 2022 | $2,444 | $266,000 | $15,100 | $250,900 |
| 2021 | $2,328 | $217,000 | $13,600 | $203,400 |
| 2020 | $2,204 | $194,000 | $13,600 | $180,400 |
| 2018 | $2,147 | $169,000 | $12,100 | $156,900 |
| 2017 | $1,755 | $151,000 | $12,100 | $138,900 |
| 2016 | $1,670 | $123,000 | $11,300 | $111,700 |
| 2015 | $1,772 | $112,000 | $12,100 | $99,900 |
| 2014 | -- | $122,000 | $12,100 | $109,900 |
| 2013 | -- | $101,000 | $12,100 | $88,900 |
Source: Public Records
Map
Nearby Homes
- 28606 16th Ave S Unit 102
- 28610 16th Ave S Unit 103
- 28418 16th Ave S Unit 101
- 28311 18th Ave S Unit A202
- 28311 18th Ave S Unit A304
- 1835 S 286th Ln Unit R-201
- 28716 18th Ave S Unit Y203
- 28821 18th Ave S
- 28601 13th Ave S
- 1840 S 284th Ln Unit H-204
- 1411 S 282nd Place
- 1110 S 287th St
- 1361 S 279th St
- 27905 Pacific Hwy S
- 28529 10th Ave S
- 28313 Redondo Way S Unit 304
- 28313 Redondo Way S Unit 102
- 28422 Military Rd S
- 28120 Redondo Beach Dr S Unit 206
- 29318 9th Place S
- 28606 16th Ave S Unit 302
- 28606 16th Ave S Unit 286023
- 28606 16th Ave S Unit 286061
- 28606 16th Ave S Unit 286024
- 28606 16th Ave S Unit 202
- 28606 16th Ave S Unit 286101
- 28606 16th Ave S Unit 286101
- 28606 16th Ave S Unit 286104
- 28606 16th Ave S Unit 203
- 28606 16th Ave S Unit 286104
- 28606 16th Ave S Unit 204
- 28606 16th Ave S Unit 201
- 28606 16th Ave S Unit 201
- 28606 16th Ave S Unit 286021
- 28606 16th Ave S Unit 286024
- 28606 16th Ave S Unit 286024
- 28606 16th Ave S Unit 286024
- 28606 16th Ave S Unit 286023
- 28606 16th Ave S Unit 204
- 28606 16th Ave S Unit 286021