Estimated Value: $585,628 - $714,000
5
Beds
3
Baths
2,500
Sq Ft
$258/Sq Ft
Est. Value
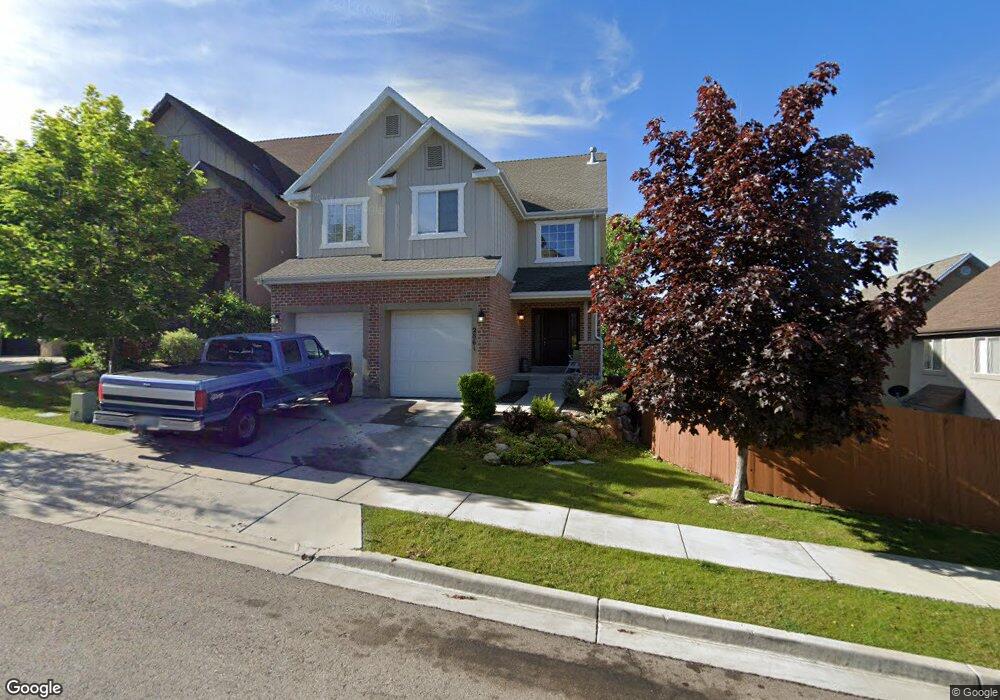
About This Home
This home is located at 2861 W Fox Hunters Loop, Lehi, UT 84043 and is currently estimated at $645,907, approximately $258 per square foot. 2861 W Fox Hunters Loop is a home located in Utah County with nearby schools including Traverse Mountain Elementary School, Skyridge High School, and Ignite Entrepreneurship Academy.
Ownership History
Date
Name
Owned For
Owner Type
Purchase Details
Closed on
Feb 10, 2010
Sold by
Huynh Dave Datphuoc and Huynh Dave
Bought by
Huynh Dave Datphuoc and Lu Karen
Current Estimated Value
Home Financials for this Owner
Home Financials are based on the most recent Mortgage that was taken out on this home.
Original Mortgage
$172,500
Outstanding Balance
$114,109
Interest Rate
5.02%
Mortgage Type
New Conventional
Estimated Equity
$531,798
Purchase Details
Closed on
Nov 17, 2007
Sold by
Huynh Dave D
Bought by
Huynh Dave D and Lu Karen
Purchase Details
Closed on
May 1, 2006
Sold by
Americraft Homes Inc
Bought by
J Ballard Homes Inc
Home Financials for this Owner
Home Financials are based on the most recent Mortgage that was taken out on this home.
Original Mortgage
$983,370
Outstanding Balance
$565,936
Interest Rate
6.29%
Mortgage Type
Construction
Estimated Equity
$79,971
Purchase Details
Closed on
Jan 4, 2006
Sold by
J Ballard Homes Inc
Bought by
Americraft Homes Inc
Home Financials for this Owner
Home Financials are based on the most recent Mortgage that was taken out on this home.
Original Mortgage
$310,500
Interest Rate
6.27%
Mortgage Type
Construction
Create a Home Valuation Report for This Property
The Home Valuation Report is an in-depth analysis detailing your home's value as well as a comparison with similar homes in the area
Home Values in the Area
Average Home Value in this Area
Purchase History
| Date | Buyer | Sale Price | Title Company |
|---|---|---|---|
| Huynh Dave Datphuoc | -- | Accommodation | |
| Huynh Dave D | -- | Accommodation | |
| J Ballard Homes Inc | -- | Lone Peak Title | |
| Americraft Homes Inc | -- | Lone Peak Title | |
| Mountain Home Development Corp | -- | Accommodation |
Source: Public Records
Mortgage History
| Date | Status | Borrower | Loan Amount |
|---|---|---|---|
| Open | Huynh Dave Datphuoc | $172,500 | |
| Open | J Ballard Homes Inc | $983,370 | |
| Previous Owner | Americraft Homes Inc | $310,500 |
Source: Public Records
Tax History Compared to Growth
Tax History
| Year | Tax Paid | Tax Assessment Tax Assessment Total Assessment is a certain percentage of the fair market value that is determined by local assessors to be the total taxable value of land and additions on the property. | Land | Improvement |
|---|---|---|---|---|
| 2025 | $2,477 | $298,815 | $191,200 | $352,100 |
| 2024 | $2,318 | $289,850 | $0 | $0 |
| 2023 | $2,318 | $294,580 | $0 | $0 |
| 2022 | $2,398 | $295,405 | $0 | $0 |
| 2021 | $2,170 | $404,100 | $110,600 | $293,500 |
| 2020 | $2,046 | $376,700 | $102,400 | $274,300 |
| 2019 | $1,935 | $370,200 | $102,400 | $267,800 |
| 2018 | $1,839 | $332,700 | $96,200 | $236,500 |
| 2017 | $1,778 | $171,050 | $0 | $0 |
| 2016 | $1,723 | $153,725 | $0 | $0 |
| 2015 | $1,702 | $144,155 | $0 | $0 |
| 2014 | $1,589 | $133,815 | $0 | $0 |
Source: Public Records
Map
Nearby Homes
- 5183 Fox Hollow Way
- 5217 N Fox Hollow Way
- 2780 Fox Hunters Loop
- Vistas Townhomes (Unita) Plan at Vistas Townhomes in Lehi - Vistas Townhomes
- Vistas Townhome (Wasatch) Plan at Vistas Townhomes in Lehi - Vistas Townhomes
- 5146 N Ravencrest Ln
- 5381 N Eagles View Dr
- 5047 N Larkwood Ln
- 4901 N Eagle Nest Ln
- 4923 N Marble Fox Way Unit 124
- 2304 W Northridge Dr
- 6197 N Fox Rd
- 2278 W Granite Arch Way
- 5034 N Marble Fox Way
- 4852 N Arctic Fox Cir
- 4665 N Stonehaven Loop
- 4685 N Pheasant Ridge Trail
- 4420 N Buckstone Way Unit 1085
- 4426 N Buckstone Way Unit 1086
- 4432 N Buckstone Way Unit 1087
- 2861 Fox Hunters Loop
- 2853 W Fox Hunters Loop
- 2853 Fox Hunters Loop
- 5214 Fox Hollow Way
- 5214 N Fox Hollow Way
- 5204 Fox Hollow Way
- 5204 N Fox Hollow Way
- 2847 W Fox Hunters Loop
- 2847 Fox Hunters Loop
- 5194 Fox Hollow Way
- 2864 W Pine Cone Ln
- 2864 Pine Cone Ln
- 2854 W Pine Cone Ln
- 2854 Pine Cone Ln
- 2829 W Fox Hunters Loop Unit 179
- 2829 Fox Hunters Loop
- 2844 W Pine Cone Ln
- 2844 Pine Cone Ln
- 5184 N Fox Hollow Way
- 5184 Fox Hollow Way