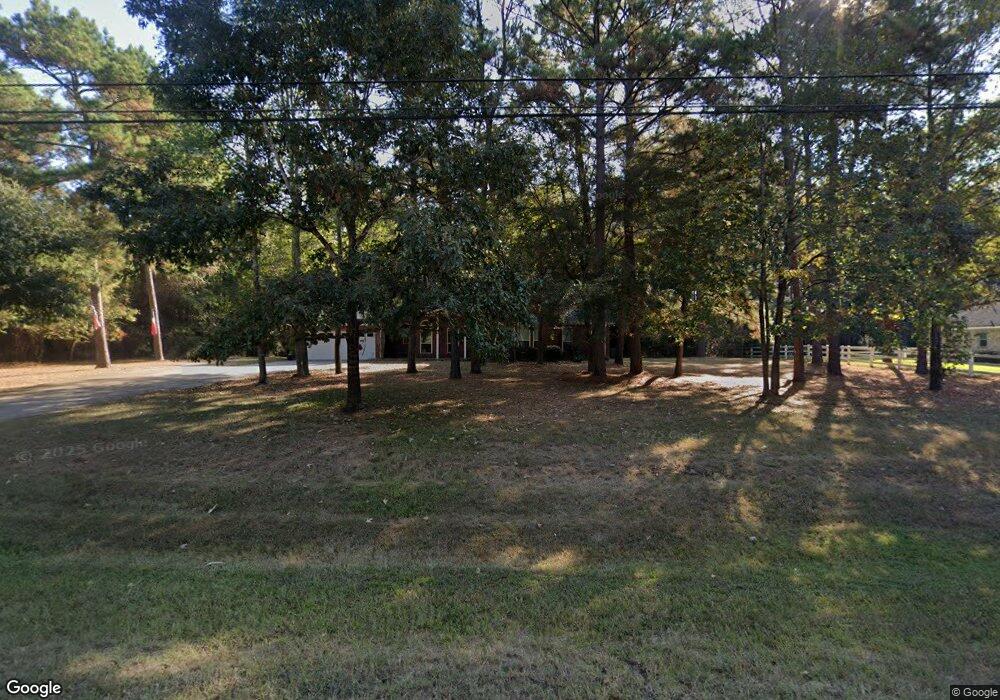
28618 Sapphire Cir Magnolia, TX 77355
Indigo Lake Estates NeighborhoodEstimated Value: $506,000 - $717,000
3
Beds
3
Baths
2,088
Sq Ft
$281/Sq Ft
Est. Value
About This Home
This home is located at 28618 Sapphire Cir, Magnolia, TX 77355 and is currently estimated at $587,214, approximately $281 per square foot. 28618 Sapphire Cir is a home located in Montgomery County with nearby schools including Nichols Sawmill Elementary School, Magnolia Sixth Grade Campus, and Magnolia Junior High School.
Ownership History
Date
Name
Owned For
Owner Type
Purchase Details
Closed on
May 30, 2014
Sold by
Hicks Leah Blagrave
Bought by
Harris Jayme
Current Estimated Value
Purchase Details
Closed on
Nov 16, 2007
Sold by
Hicks William Douglas
Bought by
Hicks Leah Blagrave
Purchase Details
Closed on
May 26, 2005
Sold by
Shormann David E and Shormann Karen
Bought by
Blagrave Hicks Jr William Douglas and Blagrave Hicks Leah
Home Financials for this Owner
Home Financials are based on the most recent Mortgage that was taken out on this home.
Original Mortgage
$156,000
Interest Rate
5.83%
Mortgage Type
Fannie Mae Freddie Mac
Purchase Details
Closed on
Jun 6, 2001
Sold by
Emmick Harold
Bought by
Shormann David E and Shormann Karen
Home Financials for this Owner
Home Financials are based on the most recent Mortgage that was taken out on this home.
Original Mortgage
$124,300
Interest Rate
7.1%
Create a Home Valuation Report for This Property
The Home Valuation Report is an in-depth analysis detailing your home's value as well as a comparison with similar homes in the area
Home Values in the Area
Average Home Value in this Area
Purchase History
| Date | Buyer | Sale Price | Title Company |
|---|---|---|---|
| Harris Jayme | -- | Stewart Title | |
| Hicks Leah Blagrave | -- | None Available | |
| Blagrave Hicks Jr William Douglas | -- | Chicago Title | |
| Shormann David E | -- | Startex Title Company |
Source: Public Records
Mortgage History
| Date | Status | Borrower | Loan Amount |
|---|---|---|---|
| Previous Owner | Blagrave Hicks Jr William Douglas | $156,000 | |
| Previous Owner | Shormann David E | $124,300 | |
| Closed | Hicks Leah Blagrave | $0 |
Source: Public Records
Tax History Compared to Growth
Tax History
| Year | Tax Paid | Tax Assessment Tax Assessment Total Assessment is a certain percentage of the fair market value that is determined by local assessors to be the total taxable value of land and additions on the property. | Land | Improvement |
|---|---|---|---|---|
| 2025 | $5,492 | $500,000 | $110,715 | $389,285 |
| 2024 | $5,452 | $505,780 | -- | -- |
| 2023 | $5,452 | $459,800 | $110,720 | $429,280 |
| 2022 | $7,376 | $418,000 | $111,320 | $385,680 |
| 2021 | $7,063 | $380,000 | $70,460 | $309,540 |
| 2020 | $7,144 | $353,000 | $70,460 | $282,540 |
| 2019 | $7,555 | $375,150 | $70,460 | $304,690 |
| 2018 | $7,071 | $369,460 | $30,200 | $339,260 |
| 2017 | $7,905 | $372,770 | $30,200 | $342,570 |
| 2016 | $8,115 | $382,670 | $30,200 | $352,470 |
| 2015 | $5,585 | $300,390 | $30,200 | $270,190 |
| 2014 | $5,585 | $270,390 | $30,200 | $240,190 |
Source: Public Records
Map
Nearby Homes
- 20302 Country Lake Dr
- 22210 Timber Ridge Dr
- 22102 Timber Ridge Dr
- 20210 Ruby Terrace Ln
- 13063 Pine Trail
- 13059 Pine Trail
- 20626 Imperial Oak Dr
- 26095 Country Pines Ct
- 20943 Forestview Dr
- 28126 Walnut Creek Ct
- 26184 Red Oak Hollow
- 19803 Ruby Terrace Ln
- 19926 Indigo Lake Dr
- 25672 Magnolia Pines Dr
- 20210 Sienna Ridge Ln
- 59 Beaconsfield Dr
- 28915 Forest Hill Dr
- 20075 Forestview Dr
- 19844 Alford Rd
- 20002 Sapphire Cir
- 28610 Sapphire Cir
- 28702 Sapphire Cir
- 22410 Timber Ridge Dr
- 28602 Sapphire Cir
- 22318 Timber Ridge Dr
- 28710 Sapphire Cir
- 28710 Sapphire Cir Unit 77355-
- 28703 Sapphire Cir
- 22310 Timber Ridge Dr
- LOT 3 Sapphire Cir
- 28711 Sapphire Cir
- 22302 Timber Ridge Dr
- 28882 Sapphire Cir
- 20310 Country Lake Dr
- 22419 Timber Ridge Dr
- 28802 Sapphire Cir
- LOT 2 Country Lake Dr
- 22218 Timber Ridge Dr
- 22395 Timber Ridge Dr
- 22403 Timber Ridge Dr