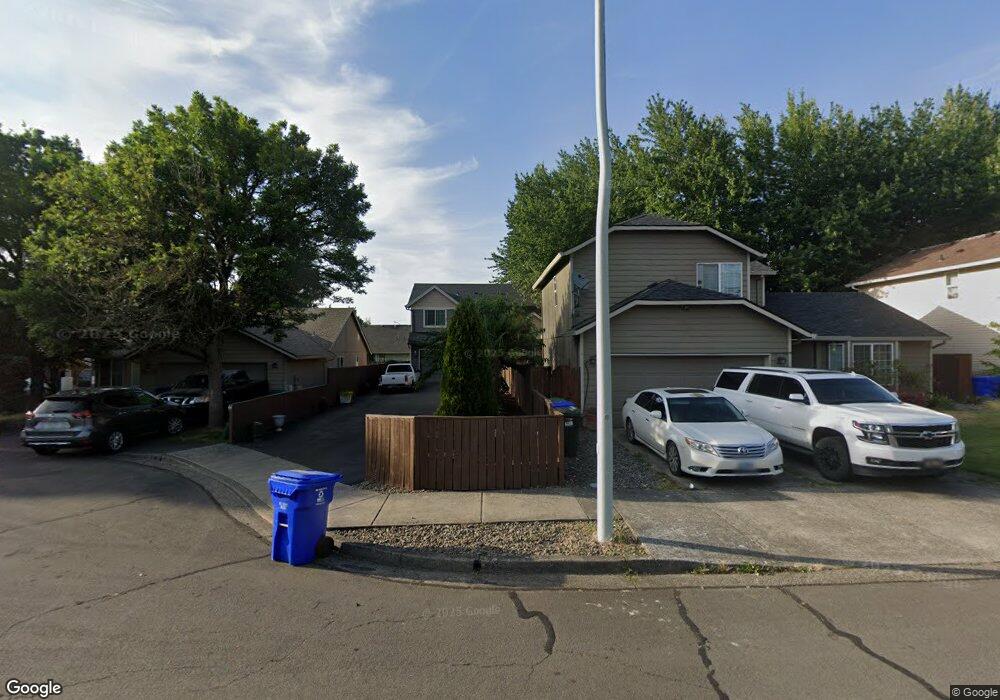
2863 SE 18th Cir Gresham, OR 97080
Mount Hood NeighborhoodEstimated Value: $454,000 - $485,000
3
Beds
3
Baths
1,550
Sq Ft
$305/Sq Ft
Est. Value
About This Home
This home is located at 2863 SE 18th Cir, Gresham, OR 97080 and is currently estimated at $472,032, approximately $304 per square foot. 2863 SE 18th Cir is a home located in Multnomah County with nearby schools including Hogan Cedars Elementary School, West Orient Middle School, and Sam Barlow High School.
Ownership History
Date
Name
Owned For
Owner Type
Purchase Details
Closed on
Mar 13, 2015
Sold by
Jle Investments Llc
Bought by
Martinez Armando and Negrete Perez Brenda I
Current Estimated Value
Home Financials for this Owner
Home Financials are based on the most recent Mortgage that was taken out on this home.
Original Mortgage
$240,562
Outstanding Balance
$181,042
Interest Rate
3.61%
Mortgage Type
FHA
Estimated Equity
$290,990
Purchase Details
Closed on
Jul 25, 2014
Sold by
Brown Steven D
Bought by
Jle Investments Llc
Home Financials for this Owner
Home Financials are based on the most recent Mortgage that was taken out on this home.
Original Mortgage
$429,000
Interest Rate
4.16%
Mortgage Type
Commercial
Purchase Details
Closed on
Jun 25, 2002
Sold by
Winters John and Winters Marcie
Bought by
Eighteenth Circle Properties Llc
Purchase Details
Closed on
Aug 9, 1999
Sold by
Winters John
Bought by
S & M Revocable Trust
Create a Home Valuation Report for This Property
The Home Valuation Report is an in-depth analysis detailing your home's value as well as a comparison with similar homes in the area
Home Values in the Area
Average Home Value in this Area
Purchase History
| Date | Buyer | Sale Price | Title Company |
|---|---|---|---|
| Martinez Armando | $245,000 | Fidelity National Title | |
| Jle Investments Llc | $225,000 | Fidelity National Title | |
| Eighteenth Circle Properties Llc | -- | -- | |
| S & M Revocable Trust | $56,000 | Oregon Title Insurance Co |
Source: Public Records
Mortgage History
| Date | Status | Borrower | Loan Amount |
|---|---|---|---|
| Open | Martinez Armando | $240,562 | |
| Previous Owner | Jle Investments Llc | $429,000 |
Source: Public Records
Tax History
| Year | Tax Paid | Tax Assessment Tax Assessment Total Assessment is a certain percentage of the fair market value that is determined by local assessors to be the total taxable value of land and additions on the property. | Land | Improvement |
|---|---|---|---|---|
| 2025 | $4,286 | $210,610 | -- | -- |
| 2024 | $4,103 | $204,480 | -- | -- |
| 2023 | $3,738 | $198,530 | $0 | $0 |
| 2022 | $3,633 | $192,750 | $0 | $0 |
| 2021 | $3,542 | $187,140 | $0 | $0 |
| 2020 | $3,333 | $181,690 | $0 | $0 |
| 2019 | $3,245 | $176,400 | $0 | $0 |
| 2018 | $3,094 | $171,270 | $0 | $0 |
| 2017 | $2,969 | $166,290 | $0 | $0 |
| 2016 | $2,618 | $161,450 | $0 | $0 |
| 2015 | $2,561 | $156,750 | $0 | $0 |
| 2014 | $871 | $53,040 | $0 | $0 |
Source: Public Records
Map
Nearby Homes
- 2846 SE 18th Cir
- 2696 SE Palmquist Rd
- 2392 SE 16th Aly
- 2073 SE Kane Ave
- 3122 SE 23rd St
- 2240 SE 16th St
- 2293 SE 15th Aly
- 2358 SE Palmquist Rd
- 2125 SE 18th Aly
- 2137 SE 15th Aly
- 2624 SE Hale Way
- 2037 SE Centurion Way
- 3689 SE 14th St
- 3780 SE 21st Dr
- 2910 SE Hillyard Rd
- 1949 SE Palmquist Rd Unit 51
- 1949 SE Palmquist Rd Unit 91
- 1949 SE Palmquist Rd Unit 121
- 732 SE Rene Ave
- 3788 SE 25th St
- 2877 SE 18th Cir
- 2847 SE 18th Cir
- 1715 SE Palmblad Rd
- 2889 SE 18th Cir
- 2833 SE 18th Cir Unit 2839
- 1686 SE Dexter Ln
- 2821 SE 18th Cir
- 1671 SE Dexter Ln
- 1705 SE Palmblad Rd
- 2890 SE 18th Cir
- 2808 SE 18th Cir
- 1649 SE Dexter Ln
- 2822 SE 18th Cir
- 2862 SE 18th Cir
- 1750 SE Palmblad Rd
- 1770 SE Palmblad Rd
- 1780 SE Cochran Dr
- 2834 SE 18th Cir
- 1634 SE Dexter Ln
- 1730 SE Cochran Dr
Your Personal Tour Guide
Ask me questions while you tour the home.