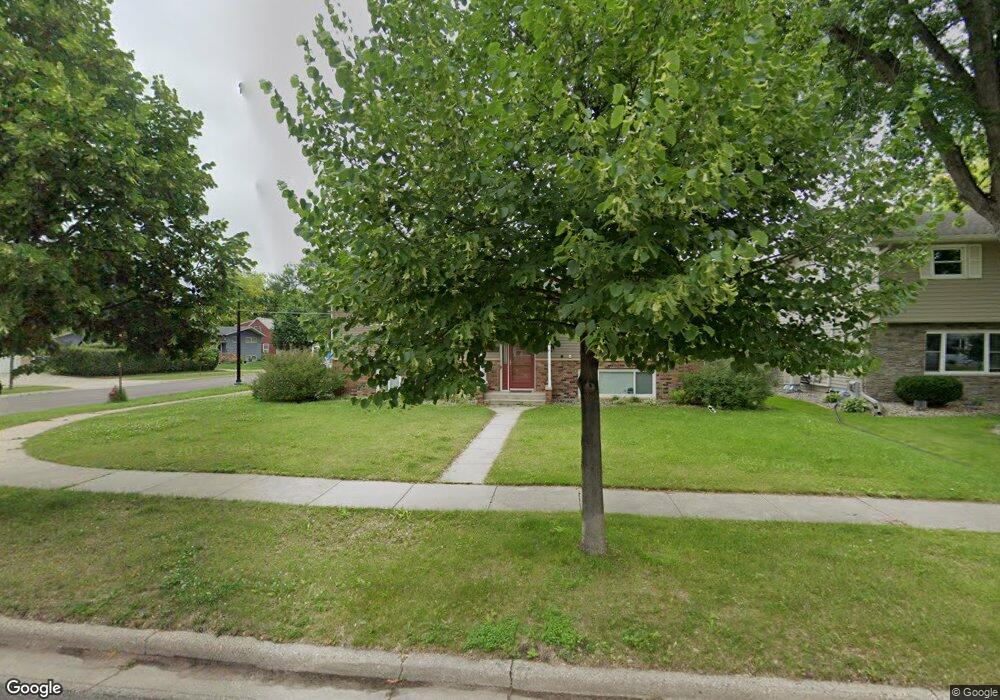
2865 2nd St N Fargo, ND 58102
Northport NeighborhoodEstimated Value: $327,698 - $380,000
5
Beds
2
Baths
2,344
Sq Ft
$152/Sq Ft
Est. Value
About This Home
This home is located at 2865 2nd St N, Fargo, ND 58102 and is currently estimated at $357,175, approximately $152 per square foot. 2865 2nd St N is a home located in Cass County with nearby schools including Longfellow Elementary School, Ben Franklin Middle School, and North High School.
Ownership History
Date
Name
Owned For
Owner Type
Purchase Details
Closed on
Jul 29, 2021
Sold by
Atanasov Yuriy A and Yordanova Salzitsa N
Bought by
Chiavetta Raymond J
Current Estimated Value
Home Financials for this Owner
Home Financials are based on the most recent Mortgage that was taken out on this home.
Original Mortgage
$294,624
Outstanding Balance
$268,025
Interest Rate
2.93%
Mortgage Type
VA
Estimated Equity
$89,150
Purchase Details
Closed on
Feb 24, 2017
Sold by
Krutsinger Lynette Kay
Bought by
Atanasov Yuriy A and Yordanova Salzitsa N
Home Financials for this Owner
Home Financials are based on the most recent Mortgage that was taken out on this home.
Original Mortgage
$188,910
Interest Rate
4.12%
Mortgage Type
New Conventional
Purchase Details
Closed on
Jan 16, 2008
Sold by
Krutsinger Gregory Clark
Bought by
Krutsinger Lynette Kay
Create a Home Valuation Report for This Property
The Home Valuation Report is an in-depth analysis detailing your home's value as well as a comparison with similar homes in the area
Home Values in the Area
Average Home Value in this Area
Purchase History
| Date | Buyer | Sale Price | Title Company |
|---|---|---|---|
| Chiavetta Raymond J | $288,000 | The Title Co Residential | |
| Atanasov Yuriy A | $209,900 | Fm Title | |
| Krutsinger Lynette Kay | -- | -- |
Source: Public Records
Mortgage History
| Date | Status | Borrower | Loan Amount |
|---|---|---|---|
| Open | Chiavetta Raymond J | $294,624 | |
| Previous Owner | Atanasov Yuriy A | $188,910 |
Source: Public Records
Tax History Compared to Growth
Tax History
| Year | Tax Paid | Tax Assessment Tax Assessment Total Assessment is a certain percentage of the fair market value that is determined by local assessors to be the total taxable value of land and additions on the property. | Land | Improvement |
|---|---|---|---|---|
| 2024 | $3,916 | $140,450 | $28,000 | $112,450 |
| 2023 | $3,663 | $132,500 | $28,000 | $104,500 |
| 2022 | $3,336 | $118,300 | $28,000 | $90,300 |
| 2021 | $2,991 | $107,550 | $28,000 | $79,550 |
| 2020 | $2,953 | $107,550 | $28,000 | $79,550 |
| 2019 | $2,994 | $107,550 | $15,550 | $92,000 |
| 2018 | $2,867 | $107,650 | $15,550 | $92,100 |
| 2017 | $2,767 | $104,500 | $15,550 | $88,950 |
| 2016 | $2,321 | $95,000 | $15,550 | $79,450 |
| 2015 | $2,470 | $95,000 | $11,650 | $83,350 |
| 2014 | $2,289 | $85,800 | $11,650 | $74,150 |
| 2013 | $1,035 | $80,200 | $11,650 | $68,550 |
Source: Public Records
Map
Nearby Homes
- 2925 Edgewood Dr N
- 87 28th Ave N
- 2937 Edgewood Dr N
- 108 32nd Ave N
- 206 32nd Ave N
- 2510 Evergreen Rd N
- 2939 Maple St N
- 3306 2nd St N Unit D26
- 21 35th Ave NE
- 35 S Woodcrest Dr N
- 305 19th Ave N
- 3521 Grandwood Dr N
- 1905 9th St N
- 3216 Broadway N
- 1645 Broadway N
- 1630 7th St N
- 3741 10th St N
- 1625 11th St N
- 1522 8th St N
- 1626 11th St N