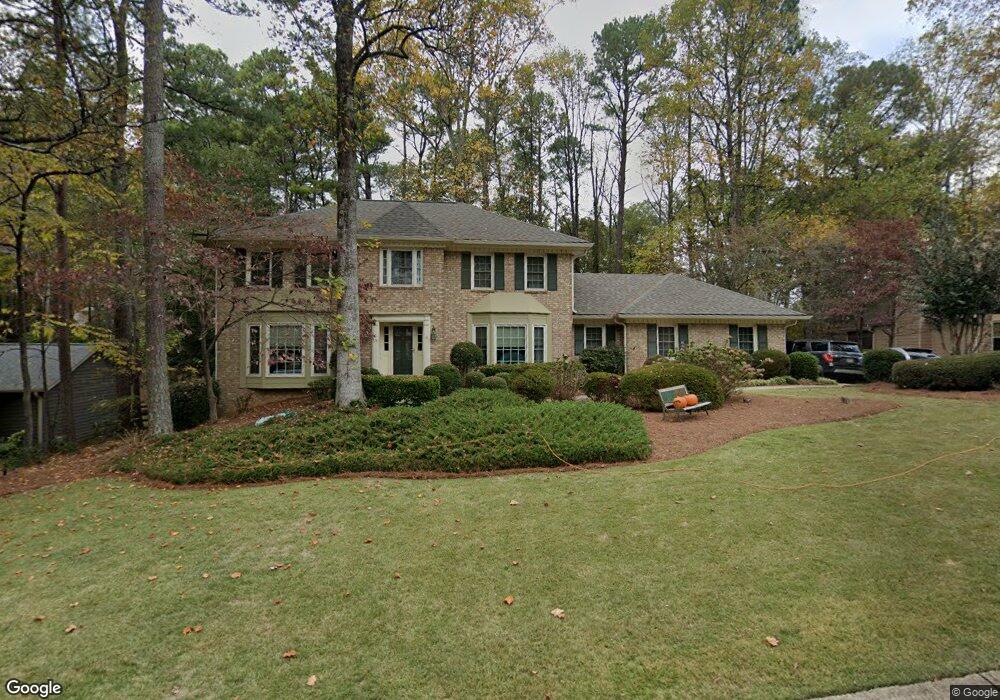
2865 Laurel Green Ct Roswell, GA 30076
Willow Springs NeighborhoodEstimated Value: $696,240 - $906,000
4
Beds
3
Baths
2,524
Sq Ft
$314/Sq Ft
Est. Value
About This Home
This home is located at 2865 Laurel Green Ct, Roswell, GA 30076 and is currently estimated at $791,810, approximately $313 per square foot. 2865 Laurel Green Ct is a home located in Fulton County with nearby schools including Northwood Elementary School, Haynes Bridge Middle School, and Centennial High School.
Ownership History
Date
Name
Owned For
Owner Type
Purchase Details
Closed on
Oct 1, 2020
Sold by
Wellborn Gerald Wayne
Bought by
Wellborn Gerald Wayne and Wellborn Sandra Elaine
Current Estimated Value
Home Financials for this Owner
Home Financials are based on the most recent Mortgage that was taken out on this home.
Original Mortgage
$206,600
Outstanding Balance
$183,760
Interest Rate
2.9%
Mortgage Type
New Conventional
Estimated Equity
$608,050
Purchase Details
Closed on
May 29, 2015
Sold by
Wellborn Gerald W
Bought by
Wellborn Gerald Wayne and Wellborn Sandra Elaine
Purchase Details
Closed on
Oct 7, 2011
Sold by
Abbott Marion E
Bought by
Wellborn Gerald W
Home Financials for this Owner
Home Financials are based on the most recent Mortgage that was taken out on this home.
Original Mortgage
$251,750
Interest Rate
4.2%
Mortgage Type
New Conventional
Purchase Details
Closed on
Feb 3, 2009
Sold by
Abbott William G Trust
Bought by
Abbott William G Family Trust
Purchase Details
Closed on
Sep 2, 2004
Sold by
Abbott William G
Bought by
Abott William G Trust
Create a Home Valuation Report for This Property
The Home Valuation Report is an in-depth analysis detailing your home's value as well as a comparison with similar homes in the area
Home Values in the Area
Average Home Value in this Area
Purchase History
| Date | Buyer | Sale Price | Title Company |
|---|---|---|---|
| Wellborn Gerald Wayne | -- | -- | |
| Wellborn Gerald Wayne | -- | -- | |
| Wellborn Gerald W | $265,000 | -- | |
| Abbott William G Family Trust | -- | -- | |
| Abott William G Trust | -- | -- |
Source: Public Records
Mortgage History
| Date | Status | Borrower | Loan Amount |
|---|---|---|---|
| Open | Wellborn Gerald Wayne | $206,600 | |
| Previous Owner | Wellborn Gerald W | $251,750 |
Source: Public Records
Tax History Compared to Growth
Tax History
| Year | Tax Paid | Tax Assessment Tax Assessment Total Assessment is a certain percentage of the fair market value that is determined by local assessors to be the total taxable value of land and additions on the property. | Land | Improvement |
|---|---|---|---|---|
| 2025 | $830 | $219,680 | $75,360 | $144,320 |
| 2023 | $6,224 | $220,520 | $58,000 | $162,520 |
| 2022 | $3,421 | $192,120 | $45,360 | $146,760 |
| 2021 | $4,080 | $186,520 | $44,040 | $142,480 |
| 2020 | $4,129 | $164,520 | $34,960 | $129,560 |
| 2019 | $692 | $161,560 | $34,320 | $127,240 |
| 2018 | $3,906 | $157,800 | $33,520 | $124,280 |
| 2017 | $3,531 | $132,960 | $37,760 | $95,200 |
| 2016 | $3,488 | $131,520 | $37,760 | $93,760 |
| 2015 | $4,196 | $131,520 | $37,760 | $93,760 |
| 2014 | $3,375 | $122,840 | $35,280 | $87,560 |
Source: Public Records
Map
Nearby Homes
- 3040 Roxburgh Dr
- 10280 Crescent Ridge Dr
- 3077 Haynes Trail
- 2642 Long Pointe
- 385 Birch Rill Dr
- 10421 Park Walk Point
- 225 Wentworth Terrace
- 10085 Old Woodland Entry
- 305 Birch Rill Dr
- 440 Guildhall Grove Unit 2
- 130 Forrest View Terrace
- 10505 Ash Rill Dr
- 10530 Haynes Forest Dr
- 530 Kearny St
- 1095 Northpointe Trace
- 710 Leeds Garden Terrace
- 2855 Laurel Green Ct
- 2875 Laurel Green Ct
- 3015 Roxburgh Dr Unit 7
- 3025 Roxburgh Dr
- 2845 Laurel Green Ct Unit 7
- 2885 Laurel Green Ct
- 0 Laurel Green Ct
- 3005 Roxburgh Dr
- 2870 Laurel Green Ct
- 2860 Laurel Green Ct Unit 7
- 2880 Laurel Green Ct
- 3035 Roxburgh Dr
- 2850 Laurel Green Ct
- 10200 Crescent Hill Ln
- 2895 Laurel Green Ct
- 10200 Cresent Hill Ln
- 2835 Laurel Green Ct Unit 7
- 2890 Laurel Green Ct
- 10170 Cresent Hill Ln
- 2864 Laurel Green Ct