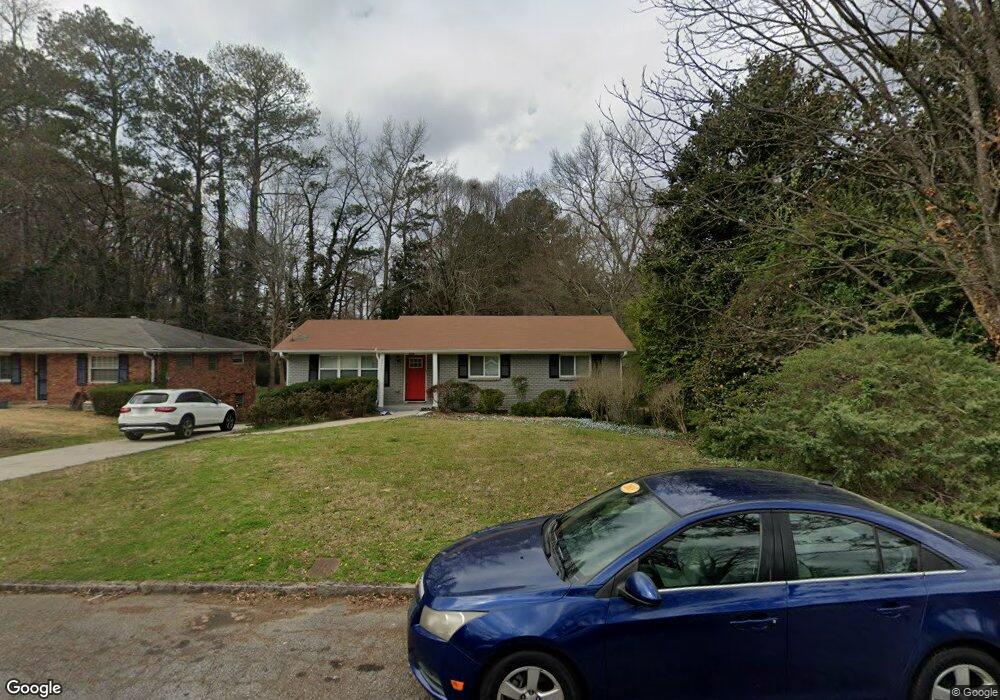
2865 Laurel Ln East Point, GA 30344
Estimated Value: $397,000 - $435,000
4
Beds
3
Baths
3,064
Sq Ft
$135/Sq Ft
Est. Value
About This Home
This home is located at 2865 Laurel Ln, East Point, GA 30344 and is currently estimated at $414,675, approximately $135 per square foot. 2865 Laurel Ln is a home located in Fulton County with nearby schools including Brookview Elementary School, Woodland Middle School, and The Main Street Academy.
Ownership History
Date
Name
Owned For
Owner Type
Purchase Details
Closed on
Mar 24, 2017
Sold by
Perez Yair Franco
Bought by
Paige Marcus
Current Estimated Value
Home Financials for this Owner
Home Financials are based on the most recent Mortgage that was taken out on this home.
Original Mortgage
$176,641
Outstanding Balance
$146,805
Interest Rate
4.25%
Mortgage Type
FHA
Estimated Equity
$267,870
Purchase Details
Closed on
Mar 22, 2012
Sold by
Federal National Mortgage Association
Bought by
Perez Yair Franco and Franco Pedro
Purchase Details
Closed on
Nov 1, 2011
Sold by
Bank Of America Na
Bought by
Federal National Mtg Associati
Purchase Details
Closed on
Oct 26, 2007
Sold by
Scenic Homes
Bought by
Palmer Charles W and Riggins Susan
Home Financials for this Owner
Home Financials are based on the most recent Mortgage that was taken out on this home.
Original Mortgage
$224,390
Interest Rate
6.32%
Mortgage Type
New Conventional
Create a Home Valuation Report for This Property
The Home Valuation Report is an in-depth analysis detailing your home's value as well as a comparison with similar homes in the area
Home Values in the Area
Average Home Value in this Area
Purchase History
| Date | Buyer | Sale Price | Title Company |
|---|---|---|---|
| Paige Marcus | $179,900 | -- | |
| Perez Yair Franco | -- | -- | |
| Federal National Mtg Associati | $211,677 | -- | |
| Bank Of America Na | $211,677 | -- | |
| Palmer Charles W | $224,400 | -- |
Source: Public Records
Mortgage History
| Date | Status | Borrower | Loan Amount |
|---|---|---|---|
| Open | Paige Marcus | $176,641 | |
| Previous Owner | Palmer Charles W | $224,390 |
Source: Public Records
Tax History Compared to Growth
Tax History
| Year | Tax Paid | Tax Assessment Tax Assessment Total Assessment is a certain percentage of the fair market value that is determined by local assessors to be the total taxable value of land and additions on the property. | Land | Improvement |
|---|---|---|---|---|
| 2025 | $2,722 | $202,960 | $35,160 | $167,800 |
| 2023 | $5,135 | $181,920 | $26,760 | $155,160 |
| 2022 | $1,797 | $181,920 | $26,760 | $155,160 |
| 2021 | $2,998 | $86,720 | $14,480 | $72,240 |
| 2020 | $3,013 | $85,720 | $14,320 | $71,400 |
| 2019 | $1,345 | $93,840 | $14,360 | $79,480 |
| 2018 | $1,688 | $71,960 | $5,400 | $66,560 |
| 2017 | $2,095 | $71,800 | $5,440 | $66,360 |
| 2016 | $2,095 | $71,800 | $5,440 | $66,360 |
| 2015 | $3,291 | $71,800 | $5,440 | $66,360 |
| 2014 | $2,201 | $71,800 | $5,440 | $66,360 |
Source: Public Records
Map
Nearby Homes
- 2837 Laurel Ridge Cir
- 3185 Hammarskjold Dr
- 5626 Laurel Ridge Dr
- 5622 Laurel Ridge Dr
- 4014 Washington Rd
- 0 Washington Rd Unit 10644974
- 0 Hammarskjold Dr Unit 7669785
- 0 Hammarskjold Dr Unit 7669772
- 0 Hammarskjold Dr Unit 7669778
- 1112 Highwood Ln
- 1214 Highwood Ln
- 507 Highwood Ln
- 4267 High Park Ln
- 4144 Janice Dr
- 4222 High Park Ln
- 4217 High Park Ln
- 3656 Mount Vernon Dr
- 4137 High Park Terrace
- 4474 Highwood Park Dr
- 2836 Aralynn Way
- 2867 Laurel Ridge Cir
- 2869 Laurel Ln
- 2865 Laurel Ridge Cir
- 0 Laurel Ridge Cir Unit 7085164
- 0 Laurel Ridge Cir Unit 8377122
- 0 Laurel Ridge Cir Unit 8236352
- 2869 Laurel Ridge Cir
- 5675 Laurel Ridge Cir
- 5659 Laurel Ridge Dr Unit 39
- 2813 Laurel Ridge Cir
- 2815 Laurel Ridge Cir
- 2774 Laurel Ridge Cir
- 2868 Laurel Ridge Cir Unit 1
- 2870 Laurel Ridge Cir Unit 4
- 2870 Laurel Ridge Cir
- 2868 Laurel Ridge Cir
- 2866 Laurel Ridge Cir
- 2868 Laurel Ridge Cir Unit 4
- 2870 Laurel Ridge Cir Unit 3
- 2872 Laurel Ridge Cir Unit 2