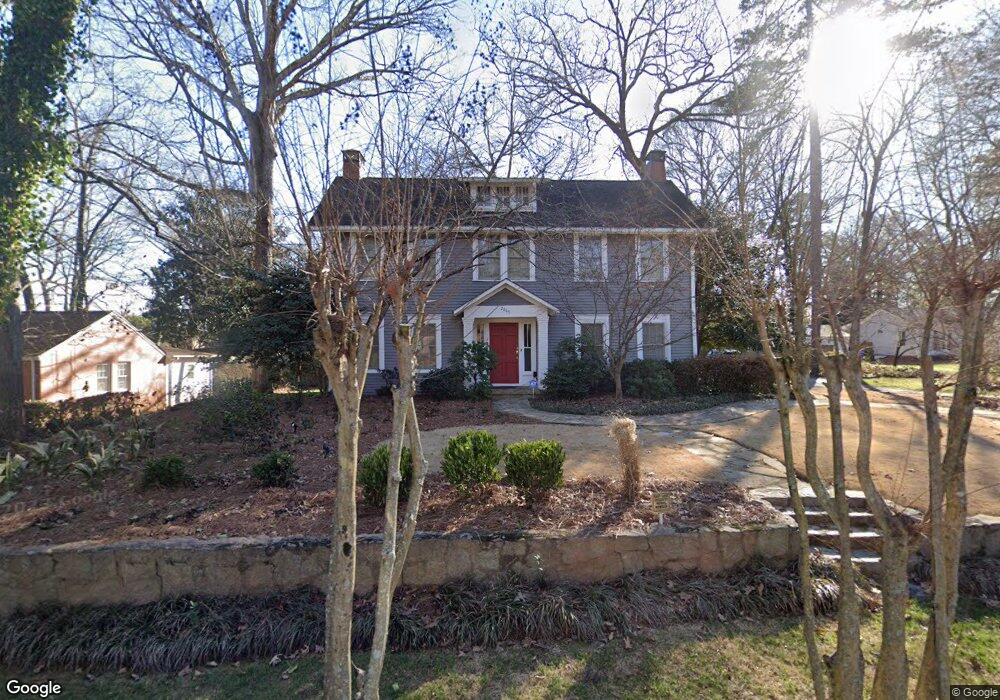
2865 Tupelo St SE Atlanta, GA 30317
East Lake NeighborhoodEstimated Value: $826,000 - $1,046,000
4
Beds
2
Baths
3,944
Sq Ft
$232/Sq Ft
Est. Value
About This Home
This home is located at 2865 Tupelo St SE, Atlanta, GA 30317 and is currently estimated at $913,580, approximately $231 per square foot. 2865 Tupelo St SE is a home located in DeKalb County with nearby schools including Toomer Elementary School, King Middle School, and Maynard Holbrook Jackson High School.
Ownership History
Date
Name
Owned For
Owner Type
Purchase Details
Closed on
May 31, 2001
Sold by
Fowler Jamie B
Bought by
Gibbs Elizabeth L
Current Estimated Value
Home Financials for this Owner
Home Financials are based on the most recent Mortgage that was taken out on this home.
Original Mortgage
$228,916
Outstanding Balance
$85,983
Interest Rate
7.11%
Mortgage Type
New Conventional
Estimated Equity
$827,597
Purchase Details
Closed on
Aug 6, 1997
Sold by
Florence J M
Bought by
Fowler Jamie B
Home Financials for this Owner
Home Financials are based on the most recent Mortgage that was taken out on this home.
Original Mortgage
$161,415
Interest Rate
7.59%
Mortgage Type
New Conventional
Purchase Details
Closed on
Feb 13, 1997
Sold by
Kotey Napoleon
Bought by
Florence J M
Purchase Details
Closed on
Jan 29, 1997
Sold by
Money Store The
Bought by
Kotey Napoleon
Purchase Details
Closed on
Sep 3, 1996
Sold by
Richardson Robert J
Bought by
The Money Store
Create a Home Valuation Report for This Property
The Home Valuation Report is an in-depth analysis detailing your home's value as well as a comparison with similar homes in the area
Home Values in the Area
Average Home Value in this Area
Purchase History
| Date | Buyer | Sale Price | Title Company |
|---|---|---|---|
| Gibbs Elizabeth L | $286,200 | -- | |
| Fowler Jamie B | $201,800 | -- | |
| Florence J M | $78,000 | -- | |
| Kotey Napoleon | $45,000 | -- | |
| The Money Store | $37,493 | -- |
Source: Public Records
Mortgage History
| Date | Status | Borrower | Loan Amount |
|---|---|---|---|
| Open | Gibbs Elizabeth L | $228,916 | |
| Previous Owner | Fowler Jamie B | $161,415 | |
| Closed | Kotey Napoleon | $0 |
Source: Public Records
Tax History Compared to Growth
Tax History
| Year | Tax Paid | Tax Assessment Tax Assessment Total Assessment is a certain percentage of the fair market value that is determined by local assessors to be the total taxable value of land and additions on the property. | Land | Improvement |
|---|---|---|---|---|
| 2025 | -- | $260,880 | $93,917 | $166,963 |
| 2024 | -- | $260,880 | $93,000 | $167,880 |
| 2023 | $5,845 | $238,040 | $59,510 | $178,530 |
| 2022 | $6,281 | $238,040 | $59,510 | $178,530 |
| 2021 | $132 | $238,040 | $58,920 | $179,120 |
| 2020 | $132 | $207,680 | $58,920 | $148,760 |
| 2019 | $64 | $252,800 | $58,920 | $193,880 |
| 2018 | $581 | $209,040 | $46,480 | $162,560 |
| 2017 | $818 | $209,080 | $36,960 | $172,120 |
| 2016 | $771 | $166,520 | $36,960 | $129,560 |
| 2014 | $530 | $144,720 | $36,960 | $107,760 |
Source: Public Records
Map
Nearby Homes
- 2824 Tupelo St SE
- 2762 Arbor Ave SE
- 2749 Memorial Dr SE
- 1533 N Ellington St SE
- 2830 Alston Dr SE
- 2676 Colgan Ct SE
- 1524 N Ellington St SE
- 49 Candler Rd NE
- 25 Daniel Ave NE
- 212 E Pharr Rd
- 2755 Pharr Rd NE
- 253 Garland Ave
- 55 Daniel Ave NE
- 2502 E Tupelo St SE
- 451 E Pharr Rd
- 463 E Pharr Rd
- 2877 Alexa Ave SE
- 2863 Tupelo St SE
- 2841 Tupelo St SE
- 0 Oakridge Ave SE Unit 7261656
- 0 Oakridge Ave SE Unit 7190960
- 0 Oakridge Ave SE Unit 8558523
- 0 Oakridge Ave SE Unit 8221452
- 0 Oakridge Ave SE Unit 8209067
- 0 Oakridge Ave SE Unit 7633143
- 0 Oakridge Ave SE Unit 7537496
- 0 Oakridge Ave SE Unit 8169930
- 0 Oakridge Ave SE Unit 8145082
- 0 Oakridge Ave SE Unit 3248086
- 2871 Tupelo St SE
- 2837 Tupelo St SE
- 2856 Tupelo St SE
- 2846 Tupelo St SE
- 149 Candler Rd SE
- 2835 Tupelo St SE
- 2880 Tupelo St SE
- 155 Candler Rd SE Unit 30