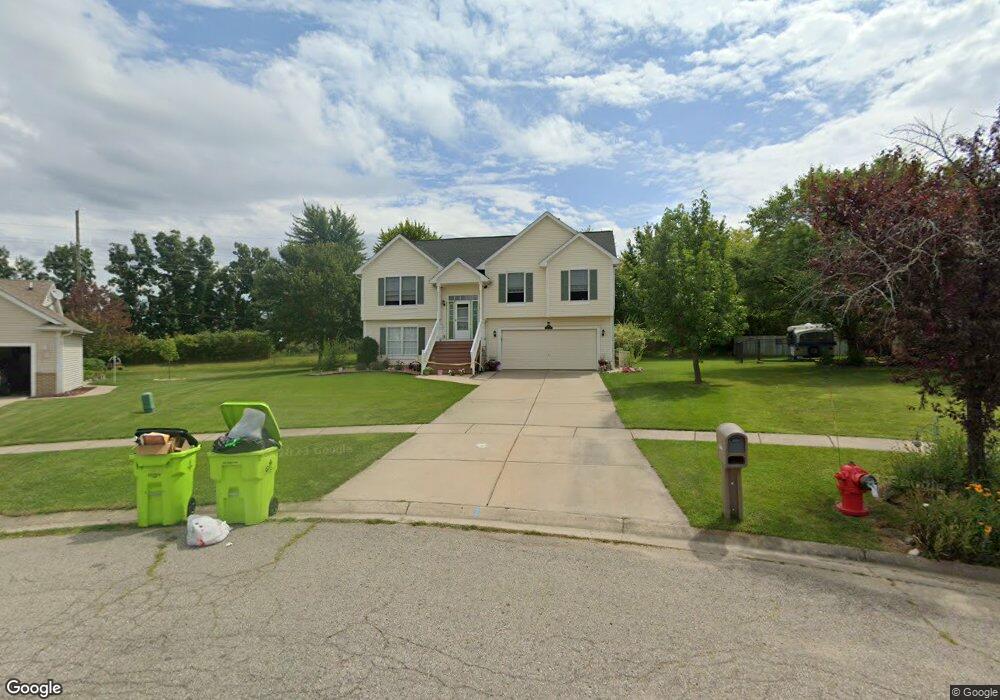
2866 Bonny Brook Dr Unit Bldg-Unit Howell, MI 48843
Estimated Value: $363,000 - $387,000
3
Beds
3
Baths
1,862
Sq Ft
$199/Sq Ft
Est. Value
About This Home
This home is located at 2866 Bonny Brook Dr Unit Bldg-Unit, Howell, MI 48843 and is currently estimated at $370,894, approximately $199 per square foot. 2866 Bonny Brook Dr Unit Bldg-Unit is a home located in Livingston County with nearby schools including Northwest Elementary School, Highlander Way Middle School, and Howell High School.
Ownership History
Date
Name
Owned For
Owner Type
Purchase Details
Closed on
Aug 12, 2021
Sold by
Ostrowski Stacey
Bought by
Ostrowski Stacey and Ostrowski Stacey Revocable
Current Estimated Value
Purchase Details
Closed on
Mar 31, 2020
Sold by
Hall Richard S and Hall Roberta A
Bought by
Ostrowski Stacey
Purchase Details
Closed on
Mar 28, 2018
Sold by
Ore Creek Dev Corp
Bought by
Hall Richard S and Hall Roberta A
Home Financials for this Owner
Home Financials are based on the most recent Mortgage that was taken out on this home.
Original Mortgage
$50,000
Interest Rate
4.43%
Mortgage Type
New Conventional
Create a Home Valuation Report for This Property
The Home Valuation Report is an in-depth analysis detailing your home's value as well as a comparison with similar homes in the area
Home Values in the Area
Average Home Value in this Area
Purchase History
| Date | Buyer | Sale Price | Title Company |
|---|---|---|---|
| Ostrowski Stacey | -- | None Available | |
| Ostrowski Stacey | $235,000 | Cislo Title Company | |
| Hall Richard S | $209,900 | -- |
Source: Public Records
Mortgage History
| Date | Status | Borrower | Loan Amount |
|---|---|---|---|
| Previous Owner | Hall Richard S | $50,000 |
Source: Public Records
Tax History Compared to Growth
Tax History
| Year | Tax Paid | Tax Assessment Tax Assessment Total Assessment is a certain percentage of the fair market value that is determined by local assessors to be the total taxable value of land and additions on the property. | Land | Improvement |
|---|---|---|---|---|
| 2025 | $2,098 | $162,900 | $0 | $0 |
| 2024 | $2,038 | $155,900 | $0 | $0 |
| 2023 | $1,947 | $133,400 | $0 | $0 |
| 2022 | $904 | $110,700 | $0 | $0 |
| 2021 | $2,620 | $117,200 | $0 | $0 |
| 2020 | $2,493 | $110,700 | $0 | $0 |
| 2019 | $2,458 | $103,700 | $0 | $0 |
| 2018 | $1,944 | $96,600 | $0 | $0 |
| 2017 | $2,811 | $94,300 | $0 | $0 |
| 2016 | $2,782 | $91,500 | $0 | $0 |
| 2014 | $2,947 | $79,100 | $0 | $0 |
| 2012 | $2,947 | $74,000 | $0 | $0 |
Source: Public Records
Map
Nearby Homes
- 1400 Oakcrest Rd
- 1633 Frech Ln
- 3040 Bogues View Dr
- 1570 Princewood Blvd
- 3224 Waverly Woods Ln
- 3227 Waverly Woods Ln
- 2653 Ravine Side N
- 571 Cannonade Loop
- 523 Cannonade Loop
- 583 Cannonade Loop
- 475 Cannonade Loop
- 2511 Kerria Dr Unit 42
- 559 Cannonade Loop
- VACANT LOT Thompson Shore Dr
- The Austin Plan at Broadmoor
- The Charlotte Plan at Broadmoor
- The Harrison Plan at Broadmoor
- The Bloomington Plan at Broadmoor
- The Columbia Plan at Broadmoor
- 3020 Brookline
- 2866 Bonny Brook Dr
- 2848 Bonny Brook Dr Unit 2
- 2863 Bonny Brook Dr
- 2830 Bonny Brook Dr Unit 3
- 2845 Bonny Brook Dr Unit 79
- 1185 Eager Pines Ct
- 2812 Bonny Brook Dr
- 2827 Bonny Brook Dr Unit 78
- 2809 Bonny Brook Dr
- 2794 Bonny Brook Dr
- 1363 Douglas Fir Dr
- 1379 Douglas Fir Dr
- 2844 Autumn Creek Ln Unit 67
- 2862 Autumn Creek Ln Unit 66
- 1347 Douglas Fir Dr
- 1163 Eager Pines Ct
- 2826 Autumn Creek Ln
- 2791 Bonny Brook Dr Unit 76
- 2776 Bonny Brook Dr
- Lot 69 Douglas Fir