2866 Kingsland Ct SE Unit 4A Atlanta, GA 30339
Estimated Value: $761,831 - $982,000
3
Beds
4
Baths
2,863
Sq Ft
$299/Sq Ft
Est. Value
About This Home
This home is located at 2866 Kingsland Ct SE Unit 4A, Atlanta, GA 30339 and is currently estimated at $856,708, approximately $299 per square foot. 2866 Kingsland Ct SE Unit 4A is a home located in Cobb County with nearby schools including Teasley Elementary School, Campbell Middle School, and Campbell High School.
Create a Home Valuation Report for This Property
The Home Valuation Report is an in-depth analysis detailing your home's value as well as a comparison with similar homes in the area
Home Values in the Area
Average Home Value in this Area
Tax History Compared to Growth
Tax History
| Year | Tax Paid | Tax Assessment Tax Assessment Total Assessment is a certain percentage of the fair market value that is determined by local assessors to be the total taxable value of land and additions on the property. | Land | Improvement |
|---|---|---|---|---|
| 2025 | $7,823 | $311,288 | $80,000 | $231,288 |
| 2024 | $7,198 | $282,196 | $74,000 | $208,196 |
| 2023 | $6,655 | $282,196 | $74,000 | $208,196 |
| 2022 | $6,844 | $263,568 | $74,000 | $189,568 |
| 2021 | $6,844 | $263,568 | $74,000 | $189,568 |
| 2020 | $5,462 | $200,394 | $66,600 | $133,794 |
| 2019 | $5,949 | $222,660 | $74,000 | $148,660 |
| 2018 | $5,949 | $222,660 | $74,000 | $148,660 |
| 2017 | $5,257 | $201,712 | $74,000 | $127,712 |
| 2016 | $4,806 | $181,056 | $70,000 | $111,056 |
| 2015 | $4,919 | $181,056 | $70,000 | $111,056 |
| 2014 | $4,088 | $146,432 | $0 | $0 |
Source: Public Records
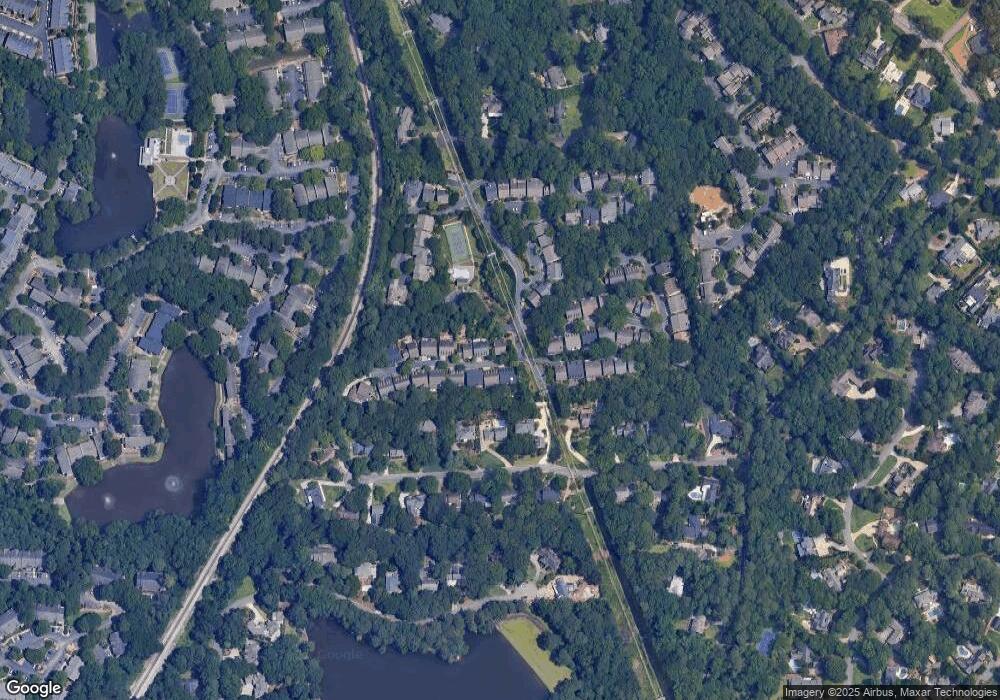
Map
Nearby Homes
- 2872 Bainbridge Way SE
- 2966 Waverly Ct SE
- 3680 Tanglewood Dr SE
- 3772 Paces Ferry West SE
- 3773 Randall Rd SE
- 3600 Tanglewood Dr SE
- 2792 Broughton Ln SE Unit 3
- 3621 Vinings Slope SE Unit 3406
- 3621 Vinings Slope SE Unit 2115
- 3621 Vinings Slope SE Unit 1530
- 3621 Vinings Slope SE Unit 1432
- 3621 Vinings Slope SE Unit 2317
- 3621 Vinings Slope SE Unit 2516
- 3621 Vinings Slope SE Unit 3311
- 3621 Vinings Slope SE Unit 1537
- 2400 Cumberland Pkwy SE Unit 614
- 2400 Cumberland Pkwy SE Unit 213
- 2400 Cumberland Pkwy SE Unit 611
- 2400 Cumberland Pkwy SE Unit 411
- 2400 Cumberland Pkwy SE Unit 613
- 2864 Kingsland Ct SE
- 2858 Kingsland Ct SE
- 2947 Kingsland Ct SE
- 2865 Kingsland Ct SE Unit 4A
- 2871 Bainbridge Way SE
- 2867 Kingsland Ct SE
- 2863 Kingsland Ct SE
- 3816 Apsley Ct SE
- 0 Bainbridge Way
- 2856 Kingsland Ct SE Unit 4B
- 3818 Courtyard Dr SE
- 0 Courtyard Dr Unit 7430125
- 0 Courtyard Dr Unit 8863067
- 0 Courtyard Dr Unit 7094350
- 2861 Kingsland Ct SE
- 0 Buckhead Dr Unit 361 8084915
- 0 Kingsland Ct SE Unit 7280214
- 0 Kingsland Ct SE Unit 7245460
- 0 Kingsland Ct SE Unit 7146864
- 0 Kingsland Ct SE Unit 8271205