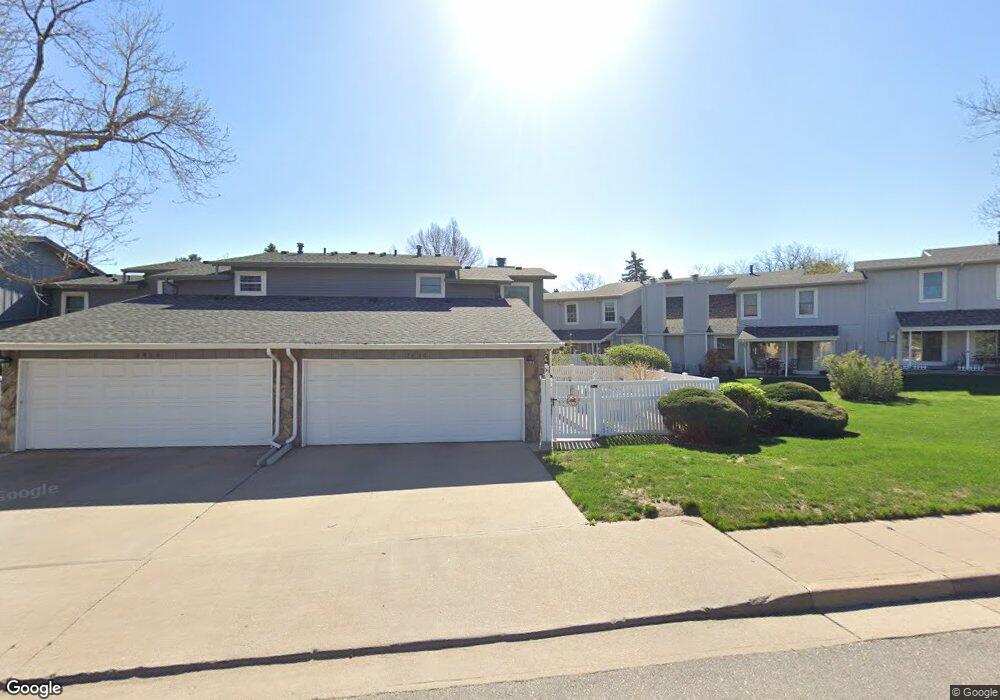
2866 S Wheeling Way Unit 20116 Aurora, CO 80014
Dam East/West NeighborhoodEstimated Value: $351,000 - $419,000
2
Beds
2
Baths
1,462
Sq Ft
$260/Sq Ft
Est. Value
About This Home
This home is located at 2866 S Wheeling Way Unit 20116, Aurora, CO 80014 and is currently estimated at $380,715, approximately $260 per square foot. 2866 S Wheeling Way Unit 20116 is a home located in Arapahoe County with nearby schools including Polton Community Elementary School, Prairie Middle School, and Overland High School.
Ownership History
Date
Name
Owned For
Owner Type
Purchase Details
Closed on
Feb 23, 1996
Sold by
Fisher John S and Fisher Gwendolyn M
Bought by
Drexler William Ridgeway and Drexler Patricia Lynn
Current Estimated Value
Home Financials for this Owner
Home Financials are based on the most recent Mortgage that was taken out on this home.
Original Mortgage
$106,300
Outstanding Balance
$3,506
Interest Rate
7.09%
Mortgage Type
FHA
Estimated Equity
$377,209
Purchase Details
Closed on
Dec 17, 1992
Sold by
Cairns Joyce H
Bought by
Fisher Gwendolyn M Fisher John S
Purchase Details
Closed on
Oct 19, 1992
Sold by
Conversion Arapco
Bought by
Cairns Joyce H
Purchase Details
Closed on
May 1, 1976
Sold by
Conversion Arapco
Bought by
Conversion Arapco
Purchase Details
Closed on
Jul 4, 1776
Bought by
Conversion Arapco
Create a Home Valuation Report for This Property
The Home Valuation Report is an in-depth analysis detailing your home's value as well as a comparison with similar homes in the area
Home Values in the Area
Average Home Value in this Area
Purchase History
| Date | Buyer | Sale Price | Title Company |
|---|---|---|---|
| Drexler William Ridgeway | $109,500 | Land Title | |
| Fisher Gwendolyn M Fisher John S | -- | -- | |
| Cairns Joyce H | -- | -- | |
| Conversion Arapco | -- | -- | |
| Conversion Arapco | -- | -- |
Source: Public Records
Mortgage History
| Date | Status | Borrower | Loan Amount |
|---|---|---|---|
| Open | Drexler William Ridgeway | $106,300 |
Source: Public Records
Tax History Compared to Growth
Tax History
| Year | Tax Paid | Tax Assessment Tax Assessment Total Assessment is a certain percentage of the fair market value that is determined by local assessors to be the total taxable value of land and additions on the property. | Land | Improvement |
|---|---|---|---|---|
| 2024 | $1,584 | $23,008 | -- | -- |
| 2023 | $1,584 | $23,008 | $0 | $0 |
| 2022 | $1,367 | $19,981 | $0 | $0 |
| 2021 | $2,124 | $19,981 | $0 | $0 |
| 2020 | $2,015 | $19,133 | $0 | $0 |
| 2019 | $1,967 | $19,133 | $0 | $0 |
| 2018 | $1,790 | $16,697 | $0 | $0 |
| 2017 | $1,773 | $16,697 | $0 | $0 |
| 2016 | $1,418 | $11,821 | $0 | $0 |
| 2015 | $1,374 | $11,821 | $0 | $0 |
| 2014 | -- | $9,353 | $0 | $0 |
| 2013 | -- | $10,260 | $0 | $0 |
Source: Public Records
Map
Nearby Homes
- 2853 S Xanadu Way
- 2855 S Xanadu Way Unit 20147
- 2829 S Xanadu Way
- 2864 S Vaughn Way
- 2888 S Ursula St
- 2894 S Ursula St
- 13184 E Linvale Place
- 13606 E Bates Ave Unit 410
- 13606 E Bates Ave Unit 102
- 13635 E Bates Ave Unit 404
- 13635 E Bates Ave Unit 201
- 13635 E Bates Ave Unit 210
- 2812 S Ursula Ct
- 13626 E Bates Ave Unit 108
- 13626 E Bates Ave Unit 302
- 13626 E Bates Ave Unit 305
- 3051 S Ursula Cir Unit 302
- 2693 S Xanadu Way Unit C
- 3041 S Ursula Cir Unit 201
- 13605 E Yale Ave Unit A
- 2864 S Wheeling Way
- 2862 S Wheeling Way
- 2860 S Wheeling Way Unit 20113
- 2874 S Wheeling Way
- 2872 S Wheeling Way
- 2876 S Wheeling Way
- 2878 S Wheeling Way
- 2870 S Wheeling Way
- 2850 S Wheeling Way Unit 20098
- 2868 S Wheeling Way
- 2848 S Wheeling Way Unit 20097
- 2880 S Wheeling Way Unit 20141
- 2858 S Wheeling Way Unit 20112
- 2870 S Vaughn Way
- 2882 S Wheeling Way
- 2846 S Wheeling Way Unit 20096
- 2872 S Vaughn Way
- 2874 S Vaughn Way
- 2856 S Wheeling Way
- 2888 S Wheeling Way Unit 20123