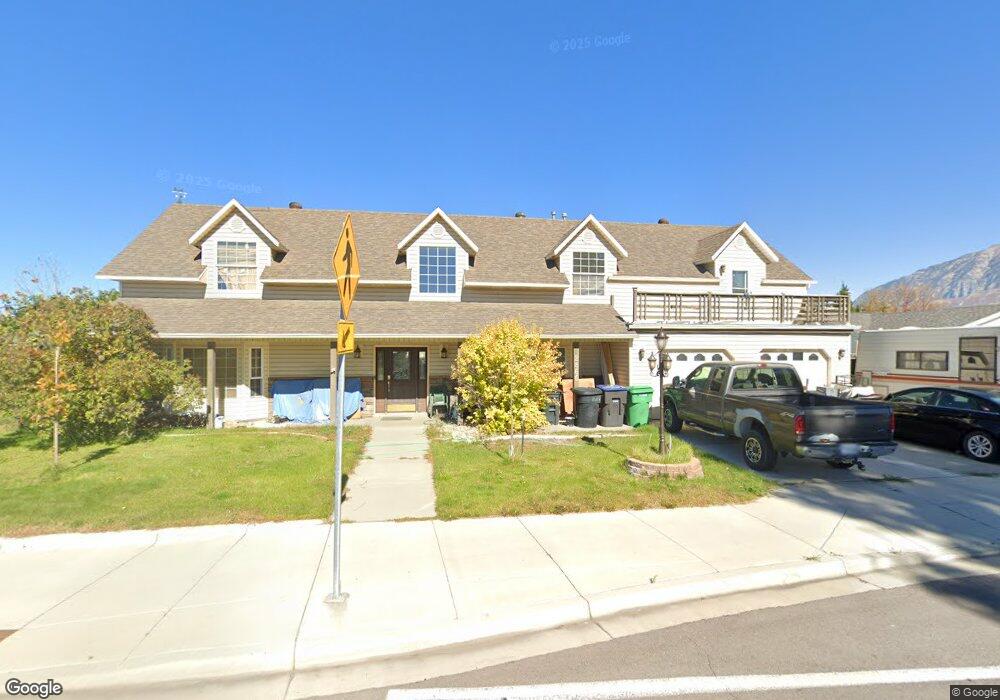
2866 W 620 N Provo, UT 84601
Lakeview NeighborhoodEstimated Value: $615,000 - $684,000
3
Beds
4
Baths
3,392
Sq Ft
$194/Sq Ft
Est. Value
About This Home
This home is located at 2866 W 620 N, Provo, UT 84601 and is currently estimated at $658,752, approximately $194 per square foot. 2866 W 620 N is a home located in Utah County with nearby schools including Lakeview School, Dixon Middle School, and Provo High School.
Ownership History
Date
Name
Owned For
Owner Type
Purchase Details
Closed on
May 27, 2021
Sold by
Hollingworth David G
Bought by
Hollingworth David G and Hollingworth Michelle
Current Estimated Value
Home Financials for this Owner
Home Financials are based on the most recent Mortgage that was taken out on this home.
Original Mortgage
$369,600
Outstanding Balance
$335,147
Interest Rate
3%
Mortgage Type
New Conventional
Estimated Equity
$323,605
Purchase Details
Closed on
Jul 1, 1997
Sold by
Hunter R P
Bought by
Hollingworth Steven G
Home Financials for this Owner
Home Financials are based on the most recent Mortgage that was taken out on this home.
Original Mortgage
$148,000
Interest Rate
7.92%
Create a Home Valuation Report for This Property
The Home Valuation Report is an in-depth analysis detailing your home's value as well as a comparison with similar homes in the area
Home Values in the Area
Average Home Value in this Area
Purchase History
| Date | Buyer | Sale Price | Title Company |
|---|---|---|---|
| Hollingworth David G | -- | Inwest Title Services | |
| Hollingworth David G | -- | Inwest Title Services | |
| Hollingworth Steven G | -- | -- |
Source: Public Records
Mortgage History
| Date | Status | Borrower | Loan Amount |
|---|---|---|---|
| Open | Hollingworth David G | $369,600 | |
| Closed | Hollingworth Steven G | $148,000 |
Source: Public Records
Tax History Compared to Growth
Tax History
| Year | Tax Paid | Tax Assessment Tax Assessment Total Assessment is a certain percentage of the fair market value that is determined by local assessors to be the total taxable value of land and additions on the property. | Land | Improvement |
|---|---|---|---|---|
| 2025 | $3,244 | $334,070 | $171,000 | $436,400 |
| 2024 | $3,165 | $319,275 | $0 | $0 |
| 2023 | $3,165 | $307,120 | $0 | $0 |
| 2022 | $568 | $312,235 | $0 | $0 |
| 2021 | $2,627 | $448,300 | $96,500 | $351,800 |
| 2020 | $2,547 | $407,500 | $87,700 | $319,800 |
| 2019 | $2,447 | $407,200 | $87,700 | $319,500 |
| 2018 | $2,023 | $341,400 | $84,100 | $257,300 |
| 2017 | $1,877 | $174,075 | $0 | $0 |
| 2016 | $1,716 | $148,280 | $0 | $0 |
| 2015 | $1,550 | $135,410 | $0 | $0 |
| 2014 | -- | $133,375 | $0 | $0 |
Source: Public Records
Map
Nearby Homes