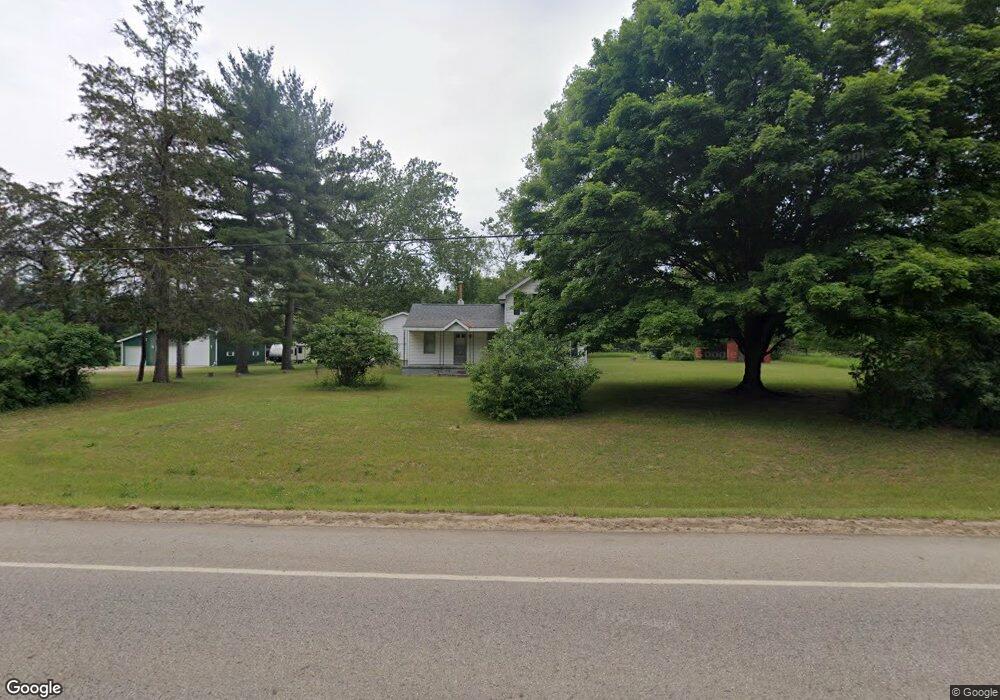
2869 114th Ave Allegan, MI 49010
Estimated Value: $131,345 - $281,000
3
Beds
1
Bath
1,272
Sq Ft
$152/Sq Ft
Est. Value
About This Home
This home is located at 2869 114th Ave, Allegan, MI 49010 and is currently estimated at $193,586, approximately $152 per square foot. 2869 114th Ave is a home located in Allegan County with nearby schools including North Ward Elementary School, L.E. White Middle School, and Allegan High School.
Ownership History
Date
Name
Owned For
Owner Type
Purchase Details
Closed on
Oct 20, 2016
Sold by
Jones Rodger M and Jones Rita J
Bought by
The Rodger M Jones & Rita J Jones Revoca
Current Estimated Value
Purchase Details
Closed on
Oct 19, 2010
Sold by
Jones Rodger M and Jones Rita J
Bought by
Jones Rodger M and Jones Rita J
Purchase Details
Closed on
Jan 21, 2000
Sold by
Jones Donn
Bought by
Jones Donn J & Wilhemina Trust
Create a Home Valuation Report for This Property
The Home Valuation Report is an in-depth analysis detailing your home's value as well as a comparison with similar homes in the area
Home Values in the Area
Average Home Value in this Area
Purchase History
| Date | Buyer | Sale Price | Title Company |
|---|---|---|---|
| The Rodger M Jones & Rita J Jones Revoca | -- | Attorney | |
| Jones Rodger M | -- | None Available | |
| Jones Rodger M | -- | None Available | |
| Jones Donn J & Wilhemina Trust | -- | -- |
Source: Public Records
Tax History Compared to Growth
Tax History
| Year | Tax Paid | Tax Assessment Tax Assessment Total Assessment is a certain percentage of the fair market value that is determined by local assessors to be the total taxable value of land and additions on the property. | Land | Improvement |
|---|---|---|---|---|
| 2025 | $977 | $42,400 | $31,400 | $11,000 |
| 2024 | $887 | $42,500 | $32,500 | $10,000 |
| 2023 | $887 | $33,800 | $25,100 | $8,700 |
| 2022 | $887 | $31,800 | $24,100 | $7,700 |
| 2021 | $827 | $30,600 | $23,300 | $7,300 |
| 2020 | $827 | $27,700 | $20,900 | $6,800 |
| 2019 | $0 | $25,300 | $18,800 | $6,500 |
| 2018 | $0 | $25,700 | $19,800 | $5,900 |
| 2017 | $0 | $25,100 | $19,500 | $5,600 |
| 2016 | $0 | $23,900 | $18,600 | $5,300 |
| 2015 | -- | $23,900 | $18,600 | $5,300 |
| 2014 | -- | $23,400 | $18,600 | $4,800 |
| 2013 | -- | $24,600 | $19,900 | $4,700 |
Source: Public Records
Map
Nearby Homes