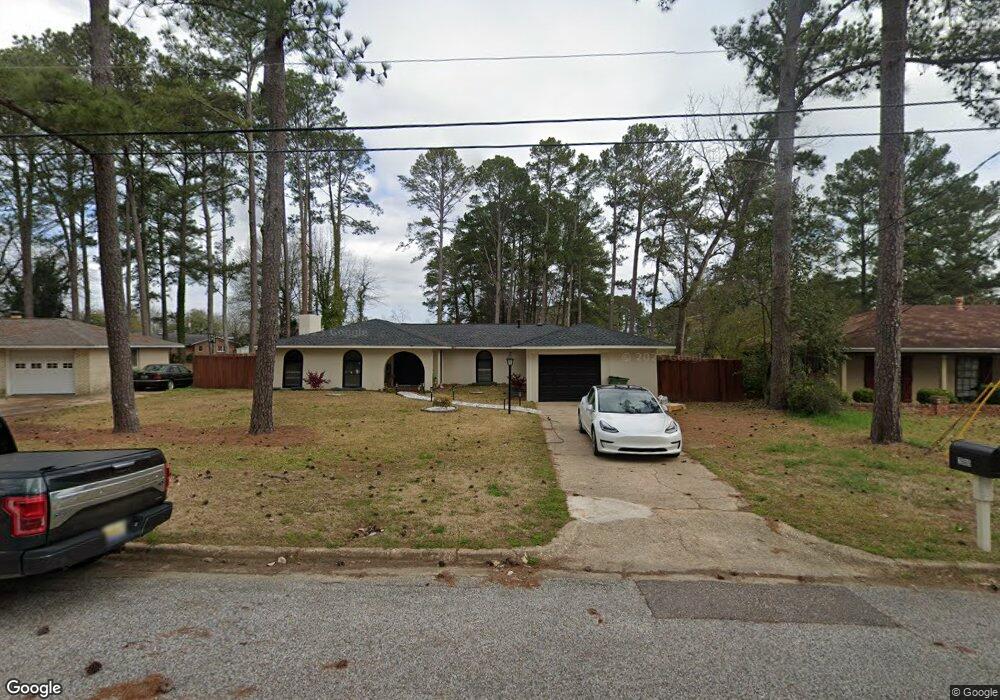
2869 Peabody Rd Montgomery, AL 36116
Estimated Value: $152,000 - $205,000
4
Beds
2
Baths
2,042
Sq Ft
$91/Sq Ft
Est. Value
About This Home
This home is located at 2869 Peabody Rd, Montgomery, AL 36116 and is currently estimated at $185,957, approximately $91 per square foot. 2869 Peabody Rd is a home located in Montgomery County with nearby schools including Crump Elementary School, McKee Middle School, and Johnson Abernathy Graetz (JAG) High School.
Ownership History
Date
Name
Owned For
Owner Type
Purchase Details
Closed on
Nov 25, 2024
Sold by
Lee Hwa
Bought by
Gray Jordan and Gray Shaddai
Current Estimated Value
Home Financials for this Owner
Home Financials are based on the most recent Mortgage that was taken out on this home.
Original Mortgage
$184,504
Outstanding Balance
$182,808
Interest Rate
6.54%
Mortgage Type
New Conventional
Estimated Equity
$3,149
Purchase Details
Closed on
Dec 28, 2023
Sold by
Rapid Fire Home Buyers
Bought by
Lee Hwa
Purchase Details
Closed on
Jan 3, 2023
Sold by
Milliken Leroy and Milliken Margie J
Bought by
Johnson Mary Ann
Purchase Details
Closed on
Mar 9, 2015
Sold by
Alderman Sam
Bought by
Boone Mary and Alderman Kim
Create a Home Valuation Report for This Property
The Home Valuation Report is an in-depth analysis detailing your home's value as well as a comparison with similar homes in the area
Home Values in the Area
Average Home Value in this Area
Purchase History
| Date | Buyer | Sale Price | Title Company |
|---|---|---|---|
| Gray Jordan | $188,000 | None Listed On Document | |
| Gray Jordan | $188,000 | None Listed On Document | |
| Lee Hwa | $52,000 | None Listed On Document | |
| Rapid Fire Home Buyers | $35,000 | None Listed On Document | |
| Johnson Mary Ann | -- | -- | |
| Johnson Mary Ann | -- | None Listed On Document | |
| Boone Mary | -- | None Available |
Source: Public Records
Mortgage History
| Date | Status | Borrower | Loan Amount |
|---|---|---|---|
| Open | Gray Jordan | $184,504 | |
| Closed | Gray Jordan | $184,504 |
Source: Public Records
Tax History Compared to Growth
Tax History
| Year | Tax Paid | Tax Assessment Tax Assessment Total Assessment is a certain percentage of the fair market value that is determined by local assessors to be the total taxable value of land and additions on the property. | Land | Improvement |
|---|---|---|---|---|
| 2025 | $1,572 | $16,210 | $1,000 | $15,210 |
| 2024 | $680 | $14,650 | $1,000 | $13,650 |
| 2023 | $680 | $12,450 | $1,000 | $11,450 |
| 2022 | $0 | $12,000 | $1,000 | $11,000 |
| 2021 | $381 | $10,260 | $0 | $0 |
| 2020 | $371 | $11,280 | $1,000 | $10,280 |
| 2019 | $348 | $10,650 | $1,000 | $9,650 |
| 2018 | $420 | $11,490 | $1,000 | $10,490 |
| 2017 | $358 | $21,860 | $2,000 | $19,860 |
| 2014 | $358 | $10,910 | $1,000 | $9,910 |
| 2013 | -- | $10,140 | $1,000 | $9,140 |
Source: Public Records
Map
Nearby Homes
- 4055 Malabar Rd
- 2699 Whispering Pine Dr
- 2621 Norwich Dr
- 3001 Shenandoah Dr
- 3120 Capwood Curve
- 3009 Montwood Ct
- 2724 Endicott Dr
- 3219 Montwood Dr
- 2642 Jan Dr
- 2637 Woodley Park Dr
- 3919 Woodley Rd
- 2629 Shadowood Ct
- 2711 Gwynnbrook Rd
- 2731 S Wallace Dr
- 2732 Baldwin Brook Dr
- 2780 S Wallace Dr
- 4622 Conti Ln
- 4009 Brighton Rd
- 2745 N Wallace Dr
- 242 Smallbrook Dr
- 2863 Peabody Rd
- 2875 Peabody Rd
- 3907 Malabar Rd
- 2857 Peabody Rd
- 3915 Malabar Rd
- 3015 Baldwin Brook Dr
- 3011 Baldwin Brook Dr
- 2868 Peabody Rd
- 2874 Peabody Rd
- 3019 Baldwin Brook Dr
- 2858 Peabody Rd
- 3900 Malabar Rd
- 2851 Peabody Rd
- 3923 Malabar Rd
- 3906 Malabar Rd
- 3009 Baldwin Brook Dr
- 3912 Malabar Rd
- 3023 Baldwin Brook Dr
- 2850 Peabody Rd
- 3854 Malabar Rd