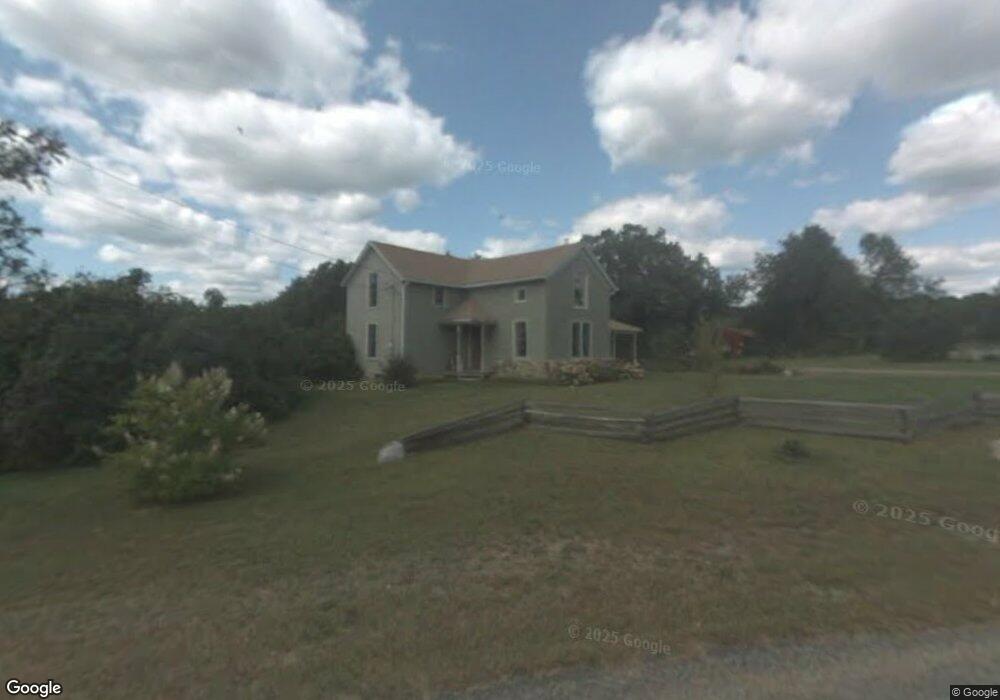
287 Fay Rd Pomfret Center, CT 06259
Estimated Value: $370,000 - $484,000
2
Beds
2
Baths
2,052
Sq Ft
$211/Sq Ft
Est. Value
About This Home
This home is located at 287 Fay Rd, Pomfret Center, CT 06259 and is currently estimated at $432,038, approximately $210 per square foot. 287 Fay Rd is a home located in Windham County with nearby schools including Pomfret Community School.
Ownership History
Date
Name
Owned For
Owner Type
Purchase Details
Closed on
Oct 22, 2020
Sold by
Daggett George R
Bought by
Daggett Dawn M
Current Estimated Value
Purchase Details
Closed on
Jun 12, 2020
Sold by
Lussier Paul R and Lussier Sherri L
Bought by
Daggett George R
Home Financials for this Owner
Home Financials are based on the most recent Mortgage that was taken out on this home.
Original Mortgage
$248,000
Interest Rate
3.2%
Mortgage Type
New Conventional
Purchase Details
Closed on
Mar 17, 2014
Sold by
Lussier Paul R and Lussier Sherri L
Bought by
Lussier Paul R and Lussier Sherri L
Purchase Details
Closed on
Aug 20, 2001
Sold by
Ocwen Fsb
Bought by
Lussier Paul R
Purchase Details
Closed on
Aug 30, 1996
Sold by
Ge Capital Mortgage Sv
Bought by
Morin Wayne S
Create a Home Valuation Report for This Property
The Home Valuation Report is an in-depth analysis detailing your home's value as well as a comparison with similar homes in the area
Home Values in the Area
Average Home Value in this Area
Purchase History
| Date | Buyer | Sale Price | Title Company |
|---|---|---|---|
| Daggett Dawn M | -- | None Available | |
| Daggett George R | -- | None Available | |
| Lussier Paul R | -- | -- | |
| Lussier Paul R | -- | -- | |
| Lussier Paul R | $160,000 | -- | |
| Morin Wayne S | $89,000 | -- |
Source: Public Records
Mortgage History
| Date | Status | Borrower | Loan Amount |
|---|---|---|---|
| Previous Owner | Daggett George R | $248,000 | |
| Previous Owner | Morin Wayne S | $35,000 | |
| Previous Owner | Morin Wayne S | $106,000 |
Source: Public Records
Tax History Compared to Growth
Tax History
| Year | Tax Paid | Tax Assessment Tax Assessment Total Assessment is a certain percentage of the fair market value that is determined by local assessors to be the total taxable value of land and additions on the property. | Land | Improvement |
|---|---|---|---|---|
| 2025 | $6,106 | $294,540 | $63,640 | $230,900 |
| 2024 | $7,999 | $191,040 | $62,140 | $128,900 |
| 2023 | $5,110 | $191,040 | $62,140 | $128,900 |
| 2022 | $5,108 | $191,040 | $62,140 | $128,900 |
| 2021 | $5,064 | $191,040 | $62,140 | $128,900 |
| 2020 | $4,367 | $158,110 | $57,610 | $100,500 |
| 2019 | $4,297 | $158,110 | $57,610 | $100,500 |
| 2018 | $4,253 | $158,110 | $57,610 | $100,500 |
| 2017 | $4,574 | $158,110 | $57,610 | $100,500 |
| 2016 | $4,048 | $158,110 | $57,610 | $100,500 |
| 2015 | $4,098 | $162,380 | $70,980 | $91,400 |
| 2014 | $3,875 | $154,210 | $62,810 | $91,400 |
Source: Public Records
Map
Nearby Homes
- 815 Mashamoquet Rd
- 834 Hampton Rd
- 00 Pilfershire Rd
- 485 Hampton Rd
- 180 Jericho Rd
- 00 Mashamoquet Rd
- 0 Jericho Rd
- 1 Jericho Rd
- 338 Brooklyn Rd
- 93 Jericho Rd
- 27 Windy Hill Rd
- 16 Pilfershire Rd
- 166 Taft Pond Rd
- 29 General Lyon Rd
- 338 Main St
- 297 Main St
- 97 Blossom Dr
- 0 Boston Turnpike
- 698 Brayman Hollow Rd
- 128 Fitzgerald Rd